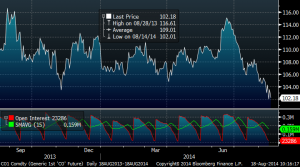
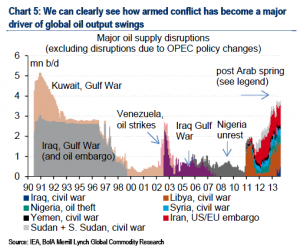
Oil prices are today below most OPEC producers’ budget needs
Oil prices needed to meet expenditure
($/bbl)
OPEC Country 2012 – 2013
Algeria 121 – 119
Angola 81 – 94
Ecuador 112 – 122
Iran 123 – 136
Iraq 100 – 116
Kuwait 61 – 59
Libya 94 – 111
Nigeria 118 – 124
Qatar 59 – 58
Saudi Arabia 87 – 92
UAE 82 – 90
Venezuela 102 – 117
Brent is down at $102.55/bbl driven by Libya has making progress in increasing production, rising to 535k b/d on increased output at the El Feel & El Shahara fields. On the geopolitical side, there are reports Kurdish forces, backed by US airstrikes, have reclaimed territory around the Mosul dam from Islamic State fighters. In Ukraine the situation remains tense with Ukrainian forces apparently reclaiming control of the police station in Luhansk that has been under rebel control for several months.
The shale gas and oil revolution in the US has shifted the geopolitical premium and has also dramatically reduced the anxiety about short term supply or needs to call on Saudi Arabia for incremental supply. The US is now the largest oil producer. U.S. production of crude oil, along with liquids separated from natural gas, surpassed all other countries this year with daily output exceeding 11 million barrels.
This shows how well supplied the market is. Despite Iraq, Ukraine, the Ebola threats to Nigeria production and geopolitical issues globally, demand cover is at five year highs in the middle of a global GDP that continues to grow.
In the US, at 366mb crude stocks are in the upper half of the average range for the time of year. Gasoline inventories are in middle of the average range. OECD inventories are at the upper level of the average range.
The IEA shows demand growth is under pressure from higher levels of efficiency and modest macroeconomic recovery. While front-month Brent is in contango the back of the curve is about $10/bbl higher than last August showing this weakness is seasonal. The IEA and EIA both lowered their global oil demand growth forecasts for 2015 by 0.1 mb/d to 1.3 mb/d and 1.4 mb/d, respectively. The IEA also reduced its 2014 demand growth projections by 0.2 mb/d to just 1 mb/d on weak 2Q14 demand growth (0.7 mb/d YoY). The IMF’s recent downgrade of its global GDP forecast by 0.3pp to 3.4% also emphasised weak economic recovery. OPEC expects global demand growth of 1.1 mb/d and 1.2 mb/d in 2014 and 2015, respectively.
In ‘The Energy World Is Flat’ (Daniel Lacalle & Diego Parrilla, Wiley 2014), our forthcoming book, we highlight the end of peak oil from the combination of efficiency and ample supply. IEA’s World Energy Outlook shows that by 2035, the world can achieve energy savings equivalent to nearly a fifth of current global demand.
Yellen & Co. are literally grasping at straws to explain the ‘phenomena’ associated with (now) normalized employment and capacity slack/low inflation.
She might want to get out and visit some of the efficiency engines across the country, starting with online commerce. Silicon Valley/SF looks, smells and tastes what you would expect (bouyant labour and wage growth and sharper inflation), at the expense of much of rest of country.
Thisn has been regularly happening over the last 300 years. Productivity/technology led disinflation can be incredibly powerful.
Coming to your industry via substitution real soon.
Important Disclaimer: All of Daniel Lacalle’s views expressed in this blog are strictly personal and should not be taken as buy or sell recommendations.


Firstly, I’d like to thank you for this perfect assestment about the oil prices evolution.
But I want to put you one question in front….How American energy independe could change the world?
I think that Cañete will have an important role to play as EU Energy and Climate Comissioner in triying to find alternative ways in the energy field.
It will kill the geopolitical risk premium. Regards