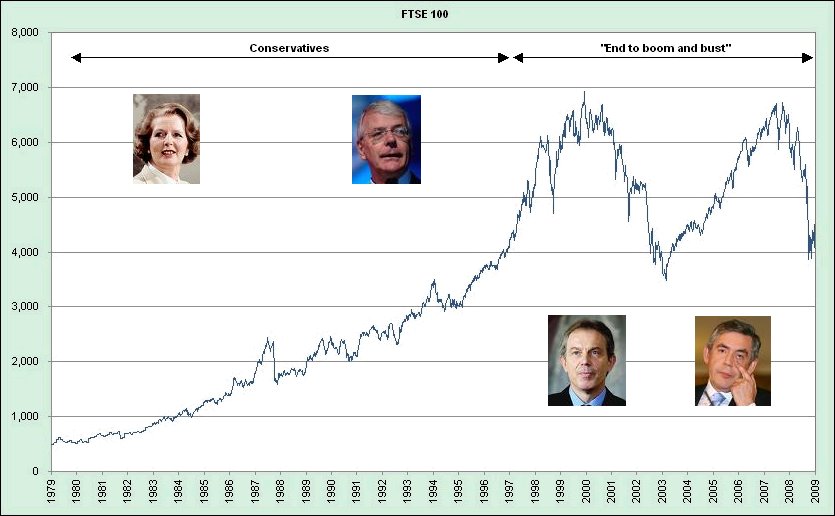
A pretty humorous chart I received last week, with obvious political connotations, but some truth embedded in it.
The basic thing that this chart shows me is that leverage and asset bubbles create huge volatility and will continue to do so. For the market to stabilize we need debt at all levels to go back to 1981-82 levels, returns to sustainable moderate growth, open market policies, lower taxes for families and industries and liberalization. What European (not only UK) governments are doing is precisely the opposite and why even after a 14% fall in the market year-to-date I see downside… It’s not about “valuation” (most valuation tools, like EV/EBITDA or Sum Of The Parts are bull market asset inflation tools) , it’s about sustainable returns over a WACC that is doing nothing but increase (cost of debt down, yes, cost of equity and risk premium up) and balance sheets that keep eroding after a period of furious M&A, growth and capex.
Worth a watch:
