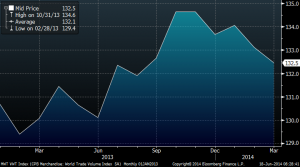
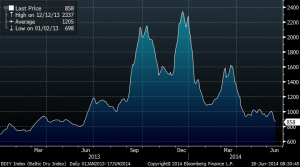
Worth noting today the evident slowdown in global trade, massively revised down (30%) from January estimates. Japan posted a 2.7% decline in exports in May, UK was also down 5% in April and Eurozone exports stalled… but at the same time the Baltic Dry Index is down 2.58%v this month (-52.3% this year) driven by ongoing weakness in Chinese overall imports. Overcapacity paints part of the picture, but the other most relevant part is weak trade data, well below the +16% increase expected in January (see graphs below). Merrill Lynch is betting on a BDI rebound helped by seasonality, re-stocking and a rise in seaborne iron ore volumes of +16% in 2014 and +10% in 2015. I fail to be that positive, as the indications from industrial production globally are negative regarding marginal additional growth expectations, as revisions are down 12% from January estimates globally and the backwardation on coal and iron ore has steepened.
If GDP forecasts are correct, the World Trade Organization expects a broad-based but modest upturn in the volume of world trade in 2014 (+4.7%), and further consolidation of this growth in 2015 (+5.3%).
The average ratio of trade growth compared to GDP since the mid-1980s is around 2 to 1 – with trade growing at twice the pace of GDP, according to the WTO. However, in the last two years the ratio was closer to 1 to 1.
To deliver on the expected +4.7% trade growth in 2014, this ratio would have to move to 2.5 to 1 from June to December assuming that global GDP growth expectations are correct (+3.3%)
Freight rates for panamax dry bulk vessels are now below opex, and long-term forward rates have fallen below break-even. The main reason for this weakness is in the coal market.
Chinese coal import is the most important trade for panamaxes and chinese imports of thermal coal are expected to be lower in 2014 than in 2013.
Capesize rates have come down 43% YTD and forward rates for Q4 fell 4% this Friday.
Adding to this a 100 milion tonnes of Australian capacity growth, the outlook for both coal prices and the Baltic Dry is not positive. Freight companies are growing the fleet by 4% this year so oversupply is even higher.
Brent at $113.58/bbl, and WTI at $106.87/bbl. The Norwegian Petroleum Directorate has issued its production numbers for May (this aggregates all Norwegian production each month). Oil is down 13% yoy and gas is down 9% yoy.
Worries about disruption to Iraq supply continue to support prices. The IEA in its medium term oil market report published yesterday cut its Iraqi supply forecast by close to 0.5m b/d & now expects it to reach only 4.5m bpd in 2019, commenting that the growth is “increasingly at risk” (this compares to the government’s target of 8.5-9m bpd by 2020).
Coal continues to weaken to $79.45/mt helped by lower Chinese imports and higher Australian exports. Chinese iron ore import prices are down 33.5% YTD.
CO2 at €5.80/mt still driven by backloading. Impact on power prices is inexistent. CO2 is up 13.4% this month and power prices are flat all over Europe.
UK gas is down 1.34% at 40.45p/th with all the gains of the Ukraine crisis erased from the price yet again. Both Europe and Ukraine have ample inventories and alternative supplies to offset disruptions. UK gas is down 40.7% YTD. UK power prices are down 12% YTD due to the weak gas price and poor demand.
Important Disclaimer: All of Daniel Lacalle’s views expressed in his books and this blog are strictly personal and should not be taken as buy or sell recommendations


