Tag Archives: global economy

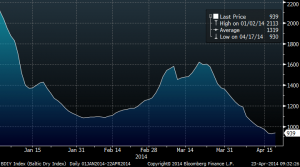
Baltic dry Index falls 58% YTD

BDI April


I mentioned it here. The Baltic Dry is showing that global trade is not improving while the fleet continues to grow.

It’s the same old scene… as Roxy Music would say. Too much supply, too little demand.

. Fleet growth +6-7% in 2014 and 4-5% in 2015. Roughly 16M DWT (dead weigh tonnage) of capacity was delivered in the first quarter of 2014 (annualized growth of 8%). A huge number not absorbed by demand.

. Spot  rates in the 6 major global routes have averaged $10kpd YTD, down $4-5kpd from last year’s levels.

Demand slowdown:

. Reported chartering data have been relatively flat compared to last year. Chartering has grown less than 1% pa in the past two years while fleet grwoth has exceeded 2.5% pa.

Capesize rates continue their free fall. Despite a solid number of new charters to China, mostly from Australia, spot Capesize rates are now at $9kpd (-64% MTD).  Brazilian activity is still low and Chinese steel demand remains poor despite stockpiles of flat and construction steel products falling, now -15% YoY.

Some positive support short term:

China continues to show strong demand for iron ore imports. Credit Suisse counted 27 iron ore fixtures last week, which is up 20% over the trailing two month average.

… But overcapacity is not addressed

The overall picture for the next two years is a moderation in the overcapacity increase, not an imprvement in the supply-demand balance. It is hard to see dayrates improving dramatically in such a scenario even if global chartering increases 5%.

High Frequency Trading and ‘Market Rigging’

My interview and debate on CNBC about High Frequency Trading.

By my colleague and friend Mike Earlywine @MEWINO, senior trader and options expert:

As you may have heard Michael Lewis has a new book out called Flash boys.  It is about High Frequency trading,(HFT) and it is creating quite the fire storm in the financial media and among the various market participants.

Michael Lewis has been in the press promoting his book by saying that the market is rigged.  Surprisingly, for how easy as it is to vilify wall street, there has been some push back.  Part of the problem is that HFT means different things to different people.  It is often confused with computer based trading or algorithmic trading.  Often it is spoken about in conspiratorial tones that make is sound illegal or something out of a bad Hollywood movie.  But his claim that the market Is rigged has galvanized many people to defend what is right about our market.  Either way,  It is a complicated topic and I hope this summary helps.

In the first part I use the Open letter from Charles Schwab to opine on what I think the real concerns are, and in the second part I give an example of HFT in its truest and simplest form

The controversy –

Like many I think the current market structure is flawed and rife with unintended consequences but I am hesitant to vilify the firms that take advantage of the fragmented market that has evolved over the past 10 years.

This letter from Charles Schwab really sets out in detail what a lot the controversy is actually about.

* My comments on the letter are in inverted commas.  http://www.aboutschwab.com/press/issues/

  • Advantaged treatment: Growing numbers of complex order types afford preferential treatment to professional traders’ orders, most notably to jump ahead of retail limit orders.
  • Unequal access to information: Exchanges allow high-frequency traders to purchase faster data feeds with detailed information about market trading activity and the specific trading of various types of market participants. This further tilts the playing field against the individual investor, who is already at an informational disadvantage by virtue of the slower Consolidated Data Stream that brokers are required by rule to purchase or, even worse, the 15- to 20-minute-delayed quote feed they have public access to.
  • Orders that jump ahead? What are these order types? I am still working with limit and market orders?!? There are no special order types just for HFT, but there are many SEC approved order types that are only used by the HFT type traders.  It can cost upwards of $50mil to put the infrastructure in place that would make some of these order types useful.

  • Is this what people mean when they say HFT guys can see an orders coming?  Are they monitoring the high-speed feed and then transacting in front of it against what are about to be stale quotes? YES that is exactly what they are doing.  The SEC is aware of and allows exchanges to sell this different feeds. After consolidating the ticker plants the high speed feeds are only 1.5milliseconds faster than the regular, but that is enough for these guys to pick off stale quotes.  (this is why co-location is so important. Every millisecond counts when your stealing fractions of a penny).


  • Inappropriate use of information: Professionals are mining the detailed data feeds made available to them by the exchanges to sniff out and front-run large institutions (mutual funds and pension funds), which more often than not are investing and trading on behalf of individual investors.
  • Can’t fault firms for taking advantage of all the information they are buying… but just what are they buying? How detailed and what data points are in there.  I can sniff out big order just watching the tape so I’m not sure how hard it would be to do if I was getting special data points. But whatever it is, it is not illegal or even surprising.


  • Added systems burdens, costs and distortions of rapid-fire quote activity: Ephemeral quotes, also called “quote stuffing,” that are cancelled and reposted in milliseconds distort the tape and present risk to the resiliency and integrity of critical market data and trading infrastructure.  The tremendous added costs associated with the expanded capacity and bandwidth necessary to support this added data traffic is ultimately borne in part by individual investors.
    • Posted shares don’t accurately reflect what can be truly transacted – HFT have a very low risk tolerance so they fade any move. They don’t stand still, they only transact when their model says they can get the offset.  I am the same way, I only transact when I think it benefits me, but I think in 5 and 10 cents increments. HFT math is done in fractions of a penny and includes rebates – my math leads to finding other intuitions with different opinions or a different urgency on timing.  Their math leads to small trades with little valuation component – rather it is based on their ability to close out the trade at a profit or flat.

    • I am constantly trying explain how I can struggle to buy 100k shares of a stock that has traded 1mil on the day.. but HFT can have that kind of effect, both through fading and because their activity can move a stock to a price level where the institutions don’t want to transact.  For example, it is not uncommon to see a stock move multiple percentage points on  HFT like activity, but when I come in to sell at that price there really is no contra side (there was no real price discovery, it was instead a temporary price inflation due to mechanical HFT strategies.)

  • This is the part that drives me crazy – I think it is probably market manipulation -They try to overwhelm the system in an effort to push the market to certain levels.  BUT the worst part of this gets little attention. By quote stuffing they are excluding participation by other investors. It is no longer about finding the right price or taking advantage of what you consider mispricing it is more about protecting turf and bending the rules to protect their access to liquidity.  The original rules of the NYSE included a rule that held an order up for a specific time so traders could match and bid or offer. It was just 1min and  allowed anyone to participate in the trade. It was there to make sure the biggest and fastest didn’t monopolize the exchange…they had it right and we have lost something in our quest for instant execution.

  • An Example and some further comments on this point:

Basic HFT example– a simplistic look at HFT trader strategy – This is an example of what they do, but it’s not what is causing the controversy


  • Exchange A pay a few basis points if you take liquidity  – business model promotes activity

Exchange B pays a few basis points for posting trades – business model incentives providing liquidity


Example


My super-fast computer sees that Exchange A   has  100 ABC offered at $20


HFT – step one –  buy the 100 from exchange A  get paid fractions of a penny on rebate

HFT – step two – offer 100 shares of ABC on exchange B at the same price or a higher price depending on my strategy and or risk tolerance

HFT – step three – hopefully someone buys those shares and I get paid again because exchange B pays for liquidity

HFT – step four – repeat thousands of times a day in hundreds of different stocks


NEED for SPEED


  1. Once I open a position I need to get in the front of the book to post my closing position to reduce my risk exposure
    1. No free lunch I am still exposed to the market and could lose money
    2. My models might have all kinds of stats on likely hood of execution  but I still need to be first to market to get paid
    3. I am competing not so much against traditional institutions but against other HFT players!
      1. I have to compete to buy or sell the opening position and I have to complete to close it too
      2. Being late can expose me to market risk that my strategy is not designed to manage

The Chinese Slowdown Impact On Commodities

China slowdown 1

29/03/14 Confidential

“China’s economic restructuring has made pre-2008 paradigms out of date and off the mark” Hanfeng Wang

I have had the pleasure of giving a masters degree on commodities at UNED, and talking to my students I was always surprised at how easily they assumed as unquestionable the expected consumption figures from China. And there is a lot to question.

When we talk about the slowdown in China some assume a total collapse. And it is not. But it’s the end of a model of aggressive debt and building “anything” to “grow”. Excessive and unproductive debt. According to Morgan Stanley the country today needs four times more debt to create an additional unit of gross domestic product compared to only five years ago.

Changing the model to a more sustainable and consumer-oriented one is not bad.

– 41% of Chinese investments flow to the consumer sector and services, compared to less than 30% a few years ago.

– The economy is being modernized: Imports of high-tech products have been reduced from 85% of the total to 71%.

– Exports of high added value goods grew 50% from five years ago to 85.4%. Incidentally, this is something that terrifies the Japanese and their “monetary imperialism” as some Asian commentators call it (https://www.dlacalle.com/abenomics-failure-in-six-charts/).

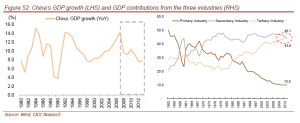
The Chinese economy is increasingly less industry and more services. Because the model was not sustainable. Gone are the steel mills that manufactured and then re-melted end product, the ghost towns and 28 million unsold homes … and the rows of windmills and solar panels without connection to the grid. Anyone who’s ever seen them never forgets them.

No one can consider the change as negative. South Korea and Taiwan held that transition without a problem, they just had to adapt to GDP growths of +2 – +4%. However, since Chinese excess debt is huge, especially in SOEs, the process is not so simple. Because the economy saves less (falling three percentage points since 2010) and borrows more.

The fact that much of this debt is financed internally by local banks does not mitigate the risk. A pyramid scheme doesn’t stop being one just because participants lend to each other.

A 200% debt to GDP when 48% of companies in the Hang Seng, especially semi-state owned do not generate returns above cost of capital is a huge problem. It has a large impact on the financing capacity of the productive sectors, as mentioned in the CICC report “A Tale of Two Economies”.

However, the slowdown of the “old Chinese economy” is not cyclical. It is structural. And it has a huge impact on the commodities market. We are seeing a very significant impact on the demand for coal, copper, iron ore and oil, creating an overcapacity that depresses prices in the medium and long term. Something that benefits other importing countries.

Producers of commodities had become accustomed to an ever increasing demand driven by China and now face the excess supply. Those producers, especially in iron ore, coal and copper, always try to replace lost revenues by producing more, thinking that in a not-too-distant future the demand slowdown will reverse. A serious mistake.

The impact of the “Chinese slowdown” in oil, copper, coal and iron ore is a much more reliable indicator of growth in industrial activity than GDP.

Let’s start with something crucial. We should not ignore the “inventory” effect. A huge amount of Chinese purchases  are not consumed, just stored. Unadjusted estimates of demand have been lethal for many producers. Inventories of iron ore for example, have risen by 57% between 2013 and 2014. And for coal and petroleum products inventories are at peak levels of 2010.

– In oil, OPEC members are already considering to reducing exports by one million barrels a day. China consumes nearly 10% of the world’s oil and means almost one third of oil exports. However, Chinese demand in January and February fell 1.9%. In the early months of 2014, adjusted for inventories (ie, removing what you buy to store) demand fell by 4.6% over the same period in 2013. Chinese demand expectations are wrongly based on the country reaching a per capita consumption similar to the U.S. or the OECD and, as always, they forget efficiency and substitution. Believe what you believe, but distrust those optimistic estimates that are reduced by 30-35% each year.

– In iron ore, China represents 63% of global exports. Analysts from UBS to Standard Chartered, warn of the difficulty for the country to meet its demand growth estimates of 3% annually, leading to an oversupply in 2014 reaching 136 million tons, 170 million in 2015. As an example of the “Chinese slowdown”, in 2012 there was a shortfall of iron ore of 70 million tonnes. In a few months it turnmed to a similar level of surplus. Chinese steel consumption has stagnated below 60 million tonnes per month since December 2012 ( https://www.dlacalle.com/iron-ore-more-oversupply-more-china-worries/ ).

– In coal, China accounts for almost 50% of world coal consumption. With a government program seeking to reduce pollution, growth expectations of Chinese demand do not exceed 1.6% per annum. That is, it is very likely that imports will not exceed 220 million tons. With growth of global production and exports from Australia, South Africa and Colombia, the world faces another year of excess supply of more than 20% ( http://www.reuters.com/article/2013/05/09/ energy-coal-idUSL6N0DQ0UU20130509 ).

– In copper, the problem is the same. Increasing supply, decreasing demand from the main consumer, China, which accounts for 39% of the global market. The estimated surplus of refined copper was revised up from 327,000 in 2014 to 369,000 metric tons, and in 2015 is expected to exceed 400,000 .

We should be very careful to ignore the effects of overcapacity when exporting countries are looking to offset lost revenues with more production, and let us not forget the depressing effect of excess storage. Because it’s a lethal combination in the world of commodities.

Ignoring the elephant in the room is one of the biggest mistakes we make when making estimates for the future. We take exceptional periods, access to credit, liquidity, consumption or growth, as new paradigms that will perpetuate forever. We do not question whether it is sustainable or not. Or worse, when it is perceived as excessive, we tend to justify it.

In the analysis of commodities the mistake is even greater because it is applied to the largest consumer in the world: China. And when economists make a mistake up to 40% in their estimates for three consecutive years but 2020 expectations remain unchanged, the problem is magnified.

Bulls already know the arguments … “Chinese demand will be multiplied by two in the next twenty years” etc.. In 2012 a friend at Exxon said to me about the Chinese growth. “I do not believe it. And those who plan using the official estimates of growth in China as a reference can only be disappointed. ”

For the commodities market, and for all, the change in the Chinese model is a positive because it was unsustainable. But let’s not ignore the wave effects it can have on a world hooked to China’s perennial growth.

Of course, many will say that everything I say is irrelevant, because China, as any good communist dictatorship, grows and consumes whatever the Communist Party decides. Yep, but the argument works both ways. If the Party decides to change the model, it will change it.

In any case, an economic model is no less unsustainable because the ruling party dictates it. It falls under its own weight sooner or later. And with a little luck, it takes the ruling party down with it.

– See more at: https://www.dlacalle.com/el-frenazo-chino-ataca-a-las-materias-primas/#sthash.yEd2qI6B.dpuf
CO2 collapses 41% MTD

CO2 2014

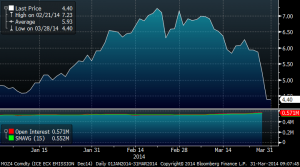
CO2 continues to collapse (-41.8% MTD, -16% YTD) after the EU intervention has failed to address the massive oversupply of free credits  and demand continues to fall.  CO2 trades at €4.5/mt (31st March 2014). It traded as high as €35/mt in 2008. -87.7% from the peak, or a massive -30.7% per annum for a “politically designed” commodity created to desincentivize CO2 emissions.

Same story over and over: Oversupply meets falling demand:

–  Oversupply: The market reserve mechanism was introduced by the EU because even once CO2 backloading is applied, the oversupply of CO2 in the EU ETS will trough at around 1.5bn credits. The reserve mechanism will be used when the total number of allowances in circulation, defined for a single year as all the allowances and international credits issued from 2008 to that year, less the total emissions produced and any already in the reserve (basically the oversupply of the system) is above a certain level. This means that oversupply of emission rights in any given year will continue to be around 2bn tons of CO2 to 2020 in the most optimistic scenario. The supply of CO2 (EUAs) has exceeded demand by at least 20m Mtons almost every month since 2010. 

– Demand down: In the EU, 2013 verified emissions for the EU-ETS will be 3.8% lower yoy, and will reach 1.79bn tCO2, while ETS demand for 2014 is expected to fall another 3%. 

According to SocGen, CO2 emissions for the largest four sectors in the EU-ETS comprise nearly 95% of all emissions, historically. Combustion installations are by far the largest contributor, emitting over 70% of all CO2 in Europe. Verified emissions for combustion installations in 2012 were 11% lower than their 2007 peak, mirroring similar decreases in electricity consumption across Europe. Emissions from energy-intensive industries, like mineral oil refineries, pig iron/steel, and cement clinker/lime production have essentially stagnated since 2009, after a material drop coinciding with the beginning of the recession.

The European Union is 30% of the emissions of the world, but (hold on) 100% of the cost as no other country has adhered to emission trading schemes. Therefore, a slowdown in industrial production and a debt crisis that could delay the extremely aggressive and optimistic plans for a low carbon economy announced for 2030, added to the slow but sure slowdown in power demand is proving that a system that was artificially created is causing the demise of a government-forced scheme that ultimately was only a tax.

CO2 (as I mentioned in 2009) is a “fake commodity” artificially invented, where demand and supply are imposed by political entities… and it still does not work. Neither the Copenhagen, or Cancun summits, or the efforts of several investment banks and environmentalists have helped to raise the price. Interventionists were rubbing their hands at the prospect of increasing the price of CO2 through more than questionable environmental policies, and now they need to find inflation through imposition.

Unless we see a much more drastic approach from the EU to address the oversupply of EUAs the picture is not positive. But at the same time, a drastic approach attacks the economic recovery and adds a burden to industries all over Europe, so I would not count on it. According to Citi it would require a 14% increase in power and industrial demand to start to address the oversupply of EUAs.

In summary, lower industrial demand is driving emissions lower, and a miscalculated free rights scheme continues to show a massive oversupply.

See more at: https://www.dlacalle.com/why-co2-collapsed-20-in-two-days/

Further read: https://www.dlacalle.com/co2-collapses-to-all-time-low/