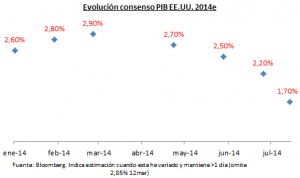
Finally…. consensus capitulates.
From The Wall street Journal morning ledger: “2014 is likely to go down as yet another disappointing year of economic growth for the U.S, according to the latest Wall Street Journal survey of economists. The 48 surveyed economists mainly cited the absence of a big spring bounce after a sharp contraction in the winter as the cause of the predicted slump. As the Wall Street Journal’s Kathleen Madigan reports, the July consensus of GDP growth of just 1.6% this year – adjusted for inflation – is quite a plunge from the 2.2% expected just a month ago. The forecasters estimate real gross domestic product grew at an annual rate of 3.1% in the second quarter, down from the 3.5% gain projected in last month’s survey. The consensus view sees growth of about 3% in the second half. “We were flat-lining in the first half,” said Diane Swonk of Mesirow Financial. “We are in another difficult year, instead of the ‘lift-off’ year we expected.” Along with the downgraded GDP forecast, respondents were evenly split about an upside or downside risk to their forecasts – something of a sea change from the results of the six previous months. In each of those surveys, about 3 out of 4 economists thought the risk was that the economy would grow faster than their forecasts expected. One problem has been the unexpected sluggishness of consumers.“
According to the Census Bureau, New Single-Family Home Sales plunged -8.1% M/M in June to a seasonally-adjusted-annualized-rate of 406k homes. On a Y/Y basis, new home sales fell -11.5% versus +2.6% previously. Furthermore, it is important to note that there were significant downward revisions to the prior months. The month of May was revised lower by a record -12.3% to 442k (504k prior), April was revised lower to 408k (425k prior), and March was revised lower to 403k (410k), representing a downward revision of -86k over the past three months! There were monthly declines across the U.S., as new home sales fell in the Northeast (-20.0% M/M and -27.3% Y/Y), the South (-9.5% M/M and -17.4% Y/Y), the Midwest (-8.2% M/M), and the West (-1.9% M/M and -9.4% Y/Y). (acc to Boenning & Scattergood)
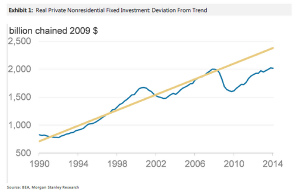
Additionally… The expected capex recovery is simply not happening, as Morgan Stanley points out.
And here’s what I said on November 23rd 2013 in “The US Growth Mirage“:
The mirage of our days may be the expectation of 2.9% growth in the United States in 2014. And it also sells a lot.The US is growing. All is well. Unemployment is low. Expansionary policy works. Does it? Not only it is not, but the most important economists of the Federal Reserve are warning about it.Look at yesterday’s GDP by categories: The “headline” +3.6% growth hides a meagre +1.9% ex-inventories. Q3 Consumer Spending +1.4%, was the weakest since December 2009. Business Inventory added 1.7% to +3.6% GDP, the most since 2011. In fact, REAL FINAL SALES (CORE GDP, EX-INVENTORIES) WAS ACTUALLY REVISED DOWN TO JUST 1.9%.
The perverse incentive to flood markets with easy money generates a massively leveraged economy (check margin debt, at record highs), moves capital to the financial sector and sinks productive investment. Gross Domestic Product (GDP) is becoming more like a soufflé , filled with air . Not only companies spend less, but the money is used to buy back stock, pay dividends and exchange capital in mergers and acquisitions, and not for added productive investment.
Between 1996 and 2006 the largest companies in the U.S. (S & P 500) invested about one trillion dollars per year, of which 70% was devoted to capex and R&D while 30% to buyback and dividends. Since 2009 the annual number of total invested capital has soared to over $2.3 trillion, but 45% is used to buy back shares and pay dividends. In fact, neither the figure of productive investment or R&D have increased substantially, inflation-adjusted, since 1998. That is, the ‘free’ money from the expansionary policy is used for protection, reducing the number of outstanding shares, merge and return cash to shareholders, not to expand organically (data from Goldman Sachs, Morgan Stanley).
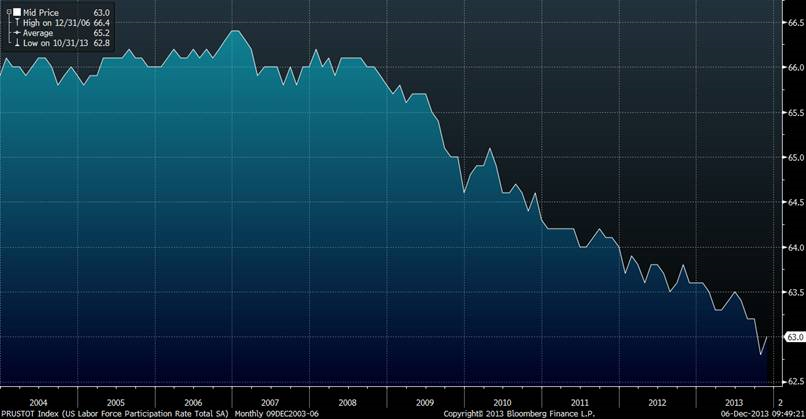
The U.S. has created nearly half of all the money supply of its history in the past five years, and has lived the longest period ever seen without raising interest rates, and yet the labour participation rate (percentage of civil population of the United States with over 16 years of age or more who have a job or are actively looking for one) has fallen to 1978 levels, 62.8%. Some explain this due to “the demographic effect”. However, adjusting for these demographic changes -there are fewer young workers and the older ones are living longer-, the labour force participation and employment has not improved since 2010 while the country engaged in money printing like crazy. Improving unemployment by ‘taking people off the lists’, as in Europe in the early 90s. Meanwhile, almost half of the working population in the U.S. earns less than $40,000 per annum.
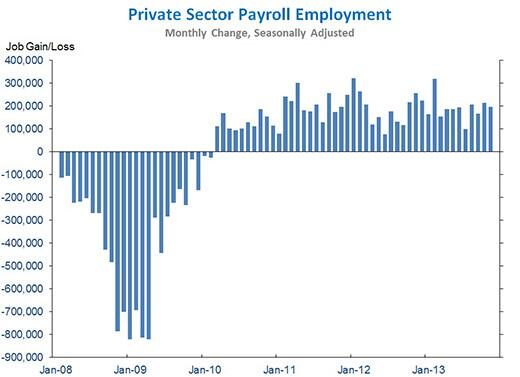
From Michael Purves: “Payrolls this week report came in with an impressive 203k gain and a 7.0% unemployment print. More importantly the jobs additions drew from a wide variety of sectors, including manufacturing, and not the lower wage and more temporary job additions we have seen in earlier reports.
The underemployment rate (U-6) also fell from 13.8% to 13.2%, representing the sharpest percentage drop since 2008. The most significant aspect of this report is not the numbers per se, but that the numbers were achieved in the context of notably higher interest rates. However, there are still notable signs of weakness: the participation rate (despite an uptick this morning) is still in a down trend, and we are still not seeing a significant improvement in average hourly earnings, or average weekly hours”.
Additionally, personal income decreased 0.1% and disposable personal income (DPI) decreased 0.2% in October.
Monetary policy is proving to be a key driver of massive inequality, and benefiting only those that held assets or have access to massive debt.
The greatest swindle since the miracle medicine men of the Wild West is to say that monetary policy is redistributive and social. But do not worry, they say, “next year, it will be better”, “Just wait.” Look at the Hiring Plans Index since 2011 (graphs from MS).
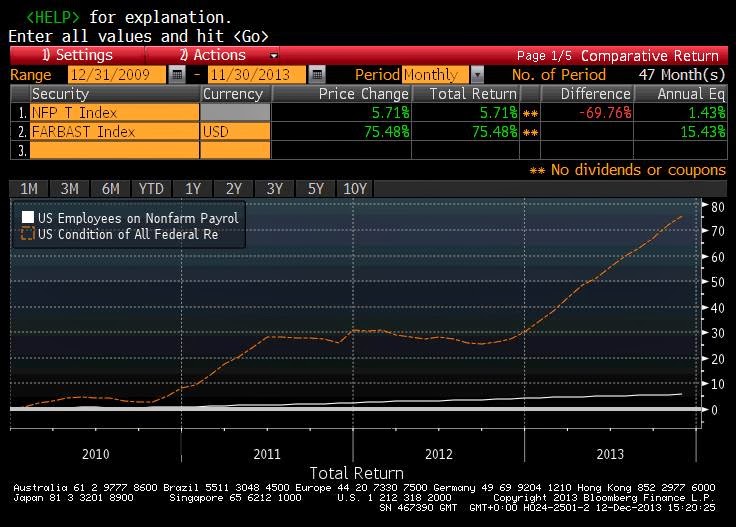
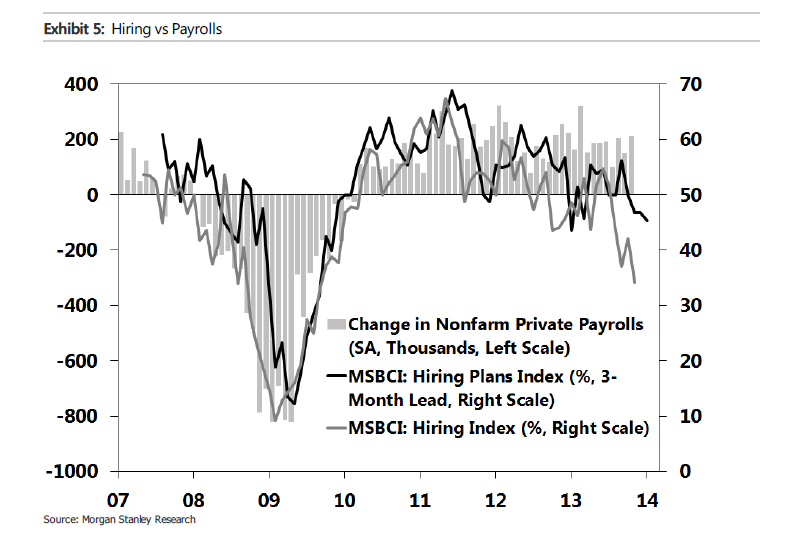 The balance of the U.S. Federal Reserve is rapidly approaching a staggering $4 trillion dollars, buying about a billion a year in bonds, yet the economy is growing well below its potential … but also that potential is deteriorating .
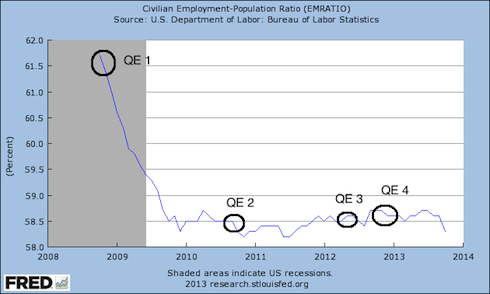
QE does not create jobs exhibit 1:
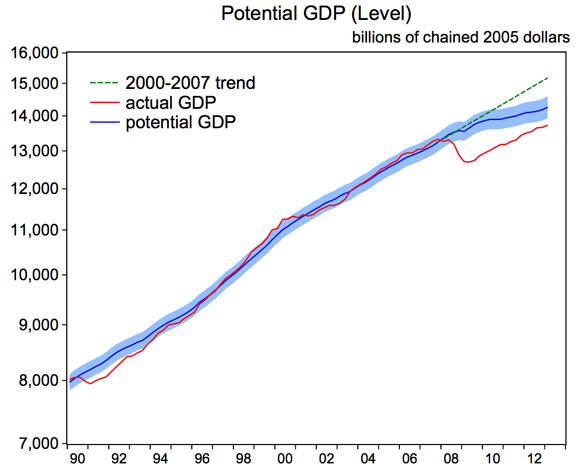
In the last two weeks I’ve read two excellent reports from Federal reserve economists William English and David Wilcox warning about the deterioration of the actual and potential growth of the United States. The graph of one of these reports shows how the correlation between potential and real GDP has broken, well below the trend from 2000 to 2007.
Companies do not invest in productive activities and job creation because conditions for confidence are simply not there. Artificially low rates and printing money may deceive a few analysts, but not presidents and CEOs of companies that have been able to be leaders and global competitors despite any government interference.
Tax increases and financial repression destroy consumption, money velocity and job creation in the medium term.
Goldman Sachs estimates that in 2014 capex and productive investment will grow by 9%. Analysing estimates and guidance for 2014 of most S&P 500 companies, I doubt it. At best, it will be flat year-on-year.
Government cannot replace private sector capex. Despite the low government bond yields and eternal lift of the debt ceiling, the U.S. continues to generate a massive deficit, projected at around $744 billion for Fiscal Year 2014. To ‘fill’ the loss of productive investment, assuming -which is a lot- that governments would spend wisely- the deficit would have to shoot another half a trillion dollars, and with it comes higher tax increases, more financial repression and… less productive investment.
True, banks are stronger and have less risk and government is borrowing at low rates. Of course they are, with a QE that is an equivalent of 6.7% of US GDP as an annual gift.
Increasing money supply by 6-7% to grow GDP by 2% is not growth, it’s stretching the pizza dough. However, a problem of wrong incentives, creating fake money and artificially low rates not only dilutes the real growth but impairs its potential one. The solution that Keynesian economists offer? … Repeat. “Until investors give in” as Paul Krugman says. More fuel to the fire.
As growth is poor, what they propose is more booze to the alcoholic. Low rates forever. Yes, many members of the U.S. central bank, like Charles Plosser, expressed doubts about the effectiveness of monetary policy, and begin to propose measures to control the madness limiting the ability of the Fed to buy assets and expand its balance sheet, but these are still voices in the desert. If you really think that forcing the machine will revive investment and job creation because it is decided by a committee, it will not happen. Until the job creators clearly see the opportunities, investment will remain low.
Reasons for concern:
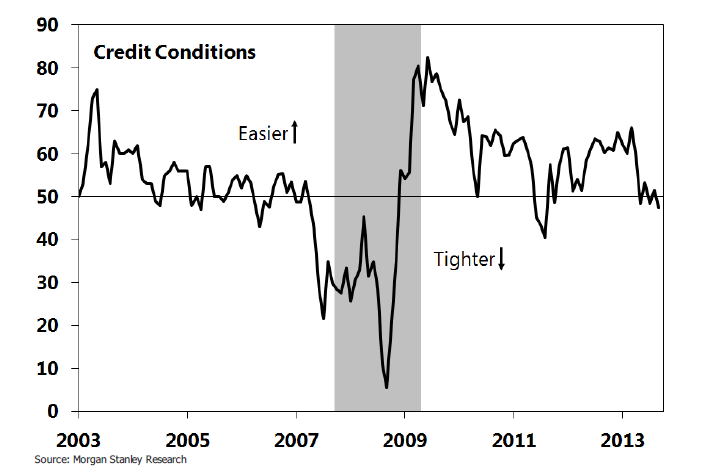
- Credit conditions are deteriorating alarmingly, which leads me to believe that productive investment will stagnate in 2014 . Estimates of increase of 9% do not agree with any of the messages thrown by the companies that published results and guidance.
- Deterioration of the leading indicators of job creation, new businesses, corporate margins and capex have accelerated since September and came into contraction long before the government shutdown.
- Estimates of profits in the industrial and consumer sector have fallen between 8% and 10% for 2014.
- In March, another drama on account of the debt ceiling and overspending and no small risk of tax hikes. With the popularity of President Obama at a minimum-37% -, the likelihood of tax increases to ‘the rich’, which is always translated into ‘tax hikes for all’, is high.
- The so-called Obamacare -mistakenly sold as the panacea of universal public health-, means about 52 billion dollars in new taxes to small businesses in particular, and the lowest estimate of the negative impact on employment that I have read is 800,000 people .
Yes, I know. For the stock market investor most of this is irrelevant. The worse, the better, and $85 billion of monthly asset purchases by the Federal Reserve, even if it is trimmed, makes everyone happy because the ‘helicopter money’ only helps the financial sector and the state, so we will ‘party like it’s 1999′ for a while. Furthermore, investors are protected by many companies who do not fall into the trap of easy money, because they are the first to suffer when the music stops.
I am sure that the innovative spirit of the country will prevail, but to estimate its economic development through the moves of a stock market impacted by share repurchases and ‘laughing gas money’ may be an illusion. Richard Koo warned that the U.S. is engaged in “the QE trap” from which you can not get out easily or comfortably. As Fleetwood Mac … Can’t Go Back.
Important Disclaimer: All of Daniel Lacalle’s views expressed in his books and this blog are strictly personal and should not be taken as buy or sell recommendations.
