Tag Archives: Energy

Non-OPEC supply growth… where?

Given that my view of non-OPEC supply goes radically against IEA and EIA estimates, here are a few highlights to track from recent reports (Simmons Institute and others):

Pemex June Production: Crude 2.52 million bbld (down 3.4% m/m from 2.61 mm bbld in May), Cantarell output was 604,498 bbld vs 641,350 bbld in May, down 5.7% m/m.

Norway: The Norwegian Petroleum Directorate (NPD) said that June liquids production was 2.083m b/d, -8.4%y/y. May was down 14% and 2Q overall down 6.8%. Gas production in June was up, 2Q was up 2% y/y.

Russia: Market expects Russia to deliver strong growth in 2009 and also in 2010. It is more likely to be flat at 10mboepd, and only because of natural gas liquids.

This means that even if we believe that Russia output will grow (and given capex cuts I find it difficult to believe, when Vankor is loss-making below $60/bbl even with the announced tax breaks), non-OPEC supply will not reach 50mbpd in 2009 versus IEA’s estimate of 50.8mbpd. 2010 non-OPEC supply may decline by 1 mmbd after peaking in 2007 (coinciding with the highest capex devoted to secondary and tertiary recovery ever senn in the industry).

2008 and 2009 were set to be key years for major project startups and production growth. However, it took a record level of startups and capex to keep non-OPEC supply just flat. Guidance for non-OPEC major project startups in 2010 and 2011 (combined) is 2 mmbd less than the 2008 + 2009 total.

Decline rates are estimated as high as 10% in non-OPEC and as from 2010 the decline in production is c3.5% pa.

Also, non-OPEC decline rates appear to have accelerated in recent years. Simmons calculate that 2008 decline rates were 1% to 2% faster than the proceeding 10-year average for 1998 to 2007.

Allow me to finish this diatribe with my favourite “underperforming versus hype” projects:

Vankor (Rosneft):Vankorskoye project (“Vankor”) was the big trumpeted start-up of 2008…. Now it’s “some time” in late 2009 (who wants to bet 2010?). The first stage of production has been quoted at 30 to 50 kbd, with Rosneft citing long-term peak production expectations of 400 kbd. Interesting to see the ramp-up curve on this one. We will likely see the figurtes quietly and surely brought down to a more realistic 250kbpd. Shell, whodiscovered it in 1988, believe it is uneconomical at $90/bbl ($60/bbl under new tax exemption if it happens) and deffinitely not as giant as Rosneft publicizes.

Atlantis (BP): First production was achieved at Atlantis in October 2007, with a near-term peak reached five months later in March 2008 at 102 kbd (almost half of BP’s trumpeted capacity for 200 kbd) despite 25 additional wells drilled by BP.

Azeri Chirag-Gunashli (BP): From 800kbpd target for 2009 to 700kbpd and falling, despite debottlenecking desperate efforts and “only” $4bn of added capex.

Thunder Horse (BP): According to a BP update in June 2009, seven production wells had been brought online thus far, with per-well production rates in excess of 40 kboed and overall production rates of approximately 300 kboed. However, liquids production target has been brought down to 150kbpd and ramp-up is now out of BP’s targets.

IEA have Russia up in 2009 vs 2008 (from 10mmbpd to 10.02) And FSU as well. They even increased estimates (IEA) in July. And they are still very close to 10mmbpd for Russia in 2010. OPEC overstates its own production (as they always do), particularly Saudi.

I find it impossible to reach IEA’s figures for those countries (US not in my list of worries). As per Halliburton’s figures the drilling is at 70% of planning capacity so it is virtually impossible to reach recovery rates. Especially in Siberia. In my view:

  1. Russia 9.8mmbpd (FSU 12.5mmbpd) versus IEA at 12.9fmmbpd
  2. Mexico 2.45mmbpd versus IEA (wait for this) 2.958!!!
  3. Norway 2mmbps (depends on corrosion) versus IEA’s 2.24mmbpd
  4. US 7.55mmbpd versus IEA’s 7.827mmbpd.

The three rules of oil investment are evident:

Don’t trust capacity estimates from ex-growth companies.

Don’t trust ramp-up figures from declining assets.

Don’t trust upgraded reserve estimates from new operators.
Oil and Gas Views

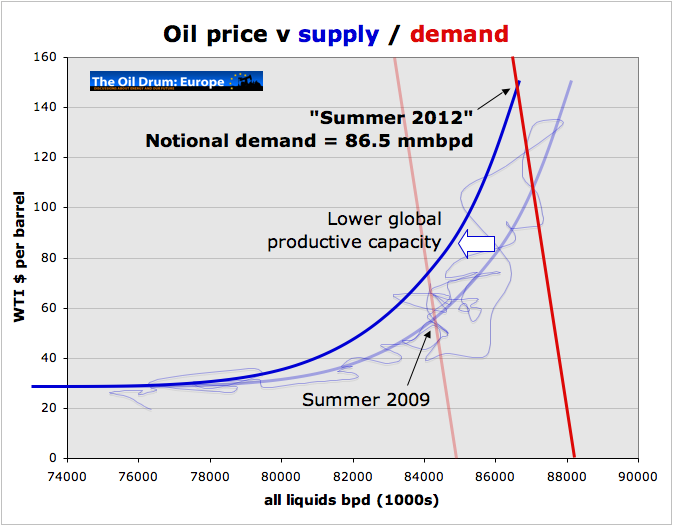
2012_demand_scen

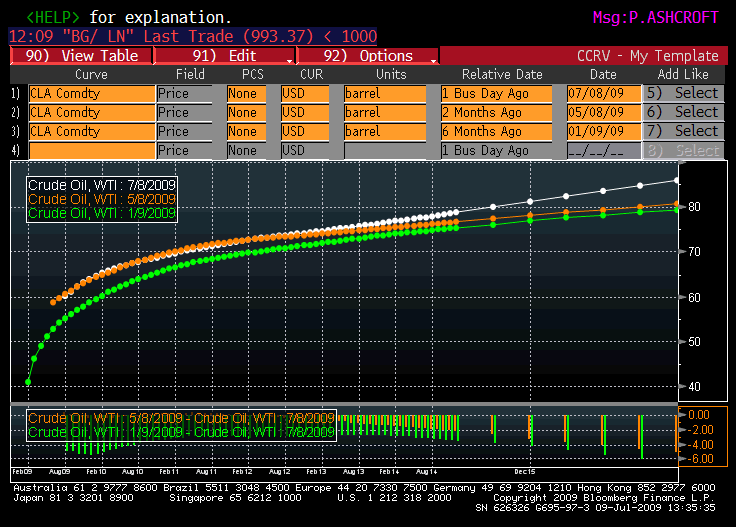
Short term I expect oil to consolidate in these levels, but no fundamental change in global economic outlook to become bearish. Inventories keep drawing, and even with Distillates at uncomfortably high levels, any tick up in demand will quickly absorb excess capacity. Global demand estimates have been revised upwards along with World Bank global GDP estimates for 2010, while capex cuts continue to affect supply, with reserve replacement below 100% since 2004 and decline rates reached 6% in 1H2009. The 10 month contango in oil, with end 2010 at $70/bbl going all the way up to $87/bbl supports this view.

Near-term risk on downside would be if the US$ dollar was to appreciate but financial players are not hugely net long so risk not that substantial.CFTC data shows net long positions in crude at 39,370 contracts, in line with 2006 levels.

Longer-term, downside risk from any reduction in OPEC compliance is offset by likelihood that non-OPEC supplies will disappoint as the year unfolds.Additionally, Iran and Venezuela break-even oil prices are at high end of $50/bbls, so they have a vested interest in keeping compliance to avoid losses.

As for natural gas, the impact of surplus LNG will continue to weigh on the market. LNG’s depressing price impact has been limited (interestingly, YTD LNG volumes are below 2008, so the glut is probably overstated). Meanwhile Continental storage is refilled and pipeline deliveries are moderated. However, by winter the full effect of the surplus is likely to be dragging the 12 month strip down to low 40s p/therm (current 48p/therm).

Oversupplied US gas market likely to keep prices depressed until there are clearer signs of the likely reduction in US domestic production. Medium-term, 12 month strip around $6.5-7.0/mmbtu seems justified (against $6-6.5/mmbtu currently) as domestic production cuts and economic recovery tighten the domestic market, but the oversupplied LNG market restricts any upside.

I expect the effect of the Gas rig count drop to level below 625 and capex cuts in US gas production to show some impact as from September, but even so supply remains more than adequate short-term.

Asian gas prices to remain largely immune from the LNG surplus, and settle at an oil linked $8-9/mmbtu.

Global Oil Production Stats

Interesting table from our friends at The Oil Drum. Only 14 of the 54 oil producing nations in the world are still increasing their oil production. Considering 2008 saw a global all-time-high in exploration and production expense, could provide some food for thought in terms of geopolitical risk changes (see which countries are depleting more rapidly) and where the new areas of resources could be coming from. To be considered past-peak, a producer’s current (2008) production has to be at least 10% less than its best year, and the best year must have occurred prior to 2005.

  • CountryPeak Prod.2008 Prod.% Off PeakPeak Year
  1. United States112977337-35%1970
  2. Venezuela37542566-32%1970
  3. Libya33571846-45%1970
  4. Other Middle East7933-58%1970
  5. Kuwait33392784 -17%1972
  6. Iran60604325-29%1974
  7. Indonesia16851004-41%1977
  8. Romania31399-68%1977
  9. Trinidad & Tobago230149-35%1978
  10. Iraq34892423-31%1979
  11. Brunei261175-33%1979
  12. Tunisia11889-25%1980
  13. Peru196120-39%1982
  14. Cameroon18184-54%1985
  15. Other Eur/Eurasia762427-44%1986
  16. Russian Federation114849886-14%1987
  17. Egypt941722-23%1993
  18. Other Asia Pacific276237-14%1993
  19. India774766-1%1995
  20. Syria596398-33%1995
  21. Gabon365235-36%1996
  22. Argentina890682-23%1998
  23. Colombia838618-26%1999
  24. United Kingdom29091544-47%1999
  25. Rep. of Congo 266249-6%1999
  26. Uzbekistan191111-42%1999
  27. Australia809556-31%2000
  28. Norway34182455-28%2001
  29. Oman961728-24%2001
  30. Yemen457305-33%2002
  31. Other S. America153138-10%2003
  32. Mexico38243157-17%2004
  33. Malaysia793754-5%2004
  34. Vietnam427317-26%2004
  35. Denmark390287-26%2004
  36. Other Africa7554-28%2004
  37. Nigeria25802170-16%2005
  38. Chad173127-27%2005
  39. Italy127108-15%2005
  40. Ecuador545514-6%2006
  41. Saudi Arabia1111410846-2%2005 / Growing?
  42. Canada33203238-2%2007 / Growing
  43. Algeria20161993-1%2007 / Growing
  44. Equatorial Guinea368361-2%2007 / Growing
  45. China37953795-Growing?
  46. United Arab Em.29802980-Growing
  47. Brazil18991899-Growing
  48. Angola18751875-Growing
  49. Kazakhstan15541554-Growing
  50. Qatar13781378-Growing
  51. Azerbaijan914914-Growing
  52. Sudan480480-Growing
  53. Thailand325325-Growing
  54. Turkmenistan205205-Growing
  • Peaked / Flat Countries Total-49597-60.6% of world oil production
  • Growing Countries Total-32223-39.4% of world oil production

"Hoarding" and short term oil price volatility

CONTANGO JULY

The recent pullback in front-end oil prices is likely to remain for a short period of time. Hoarding is to blame. The Chinese government revises petroleum product prices every 30 days or so. The required increases in the past months has led to the phenomenon of “hoarding”, as participants in China buy large quantities of oil in anticipation of a price increase to match international prices. This practice has led to an increase in oil purchases of 3million barrels per day from May to June, which justified the increase to $68/barrel. Once this “hoarding” cycle is over, the recent pullback is easily justified. Hard to envisage a large increase in short term demand to offset this extraordinary buying activity, but there is certainly a “short covering” effect likely to cushion the fall. Oil has not risen to stratospheric levels and is still in reasonable levels considering average production costs, so the funds that have shorted into the hoarding cycle will likely unwind their trade gradually.