Tag Archives: Energy

Weekly commodity outlook

Oil continues to drive the commodity complex.Why is oil more buoyant than other commodities?Probably more to do with funds flows and consistently positive macro-economic datapoints (up to the end of week US unemployment data) rather than any specifics relating to the oil market.Could this change near-term: we think not.Next week will see the three main forecasting agencies publish monthly updates; their demand estimates have started to move up (and look to have further to go) but more importantly supply estimates still look too optimistic.

Why is gas not following oil?In the US, the weight of evidence that is pointing to improved productivity means that the US will be self-sufficient even allowing for a reasonable demand recovery in 2010.Outside the US, gas’ recent weakness relates more to higher Qatari and Nigerian LNG exports (maybe 1.5bcf/d), but this is still small in relation to the issue of Gazprom releasing the gas buyers from pipeline deliveries (potentially 6bcf/d).So need to watch those Gazprom negotiations, but we’d stay positive on gas outside the US.

Why is coal no longer following oil?Much of the positive demand trends (eg South Korea) and supply restrictions (Australia and Colombia) remain.However, for once there was a big pick-up in South African exports.Newsflow is scant but we suspect that this could signal the expanded port capacity is becoming operational; which if confirmed could see coal prices give up their sharp contango.

In short, retain a bull view on energy, but recognize that this is becoming confined to oil and gas outside the US.And the risk of higher coal supply out of South Africa, if confirmed, could push us to a bearish stance on thermal coal.

ECONOMIC BACKDROP:

Bull news:

  • Chinese October PMI rises to 55.2 v 54.3 prior, and the State Council Research Centre predicts 9.5% Q4 GDP growth
  • US October ISM rises to 55.7 v 52.9 prior, while Sept factory orders up 0.9% mom versus -0.8% in August.
  • UK Sept Industrial Production up 1.2% mom.
  • Bear news:
  • US October unemployment rate hits 10.2% against an expectation of a rise to 9.9% from September’s 9.8%.

OIL OUTLOOK: POSITIVE

Bull news:

  • Chinese apparent crude oil demand lifted to 3.3% in H1 after declining 1% in H1. Car sales up 76% YoY.
  • Yemeni based terrorist activity aimed at Saudi Arabia is increasing, although yet to get much media attention.

Bear news:

  • OPEC October output rises, although concentrated in Nigeria.Shell indictes it still has 0.8mbpd shut-in in Nigeria (the lull in rebel activity is unlikely to be permanent but should last beyond the turn of the year).
  • Russian oil output tops 10mbpd in October.

GAS OUTLOOK: NEUTRAL

Bulls on US gas are receding rapidly with the weight of evidence about the resilience of US domestic gas production.Bearish gas pricing could spread outside the US but only if Gazprom forces its pipeline gas into Europe, as then surplus LNG would push UK pricing closer to Henry Hub.Gazprom will allow gas buyers to lift less than contract commitments.

US depressed by domestic supply, Europe heading for balance thanks to Gazprom

Bull news:

  • Russian Sakhalin LNG is taking one of its two trains down till the year end, taking 0.6bcf/d.
  • Ukraine negotiating a postponement in its payment for October gas (from 7th November to 20th November) doesn’t bode well for Gazprom’s ability to push its volumes into Europe, although October itself saw European exports up 3.1bcf/d (19%) mom.

Bear news:

  • US official August gas production data showed a 0.5bcf/d increase mom even though this is more than six months after the gas rig rate was in freefall (it declined by over one-third from its September 2008 peak by the end of February 2009).Moreover, Chesapeake’s Q3 beat estimates in part thanks to lower costs.
  • Qataris reveal that all three of its new megatrains are at full capacity (totaling 3.2bcfpd and adding 1.5-2.0bcf/d over expectations).

COAL OUTLOOK: Neutral

Bull news:

  • Monthly Australian thermal coal exports drop to 10.7mt in September, the lowest since April, as met coal crowds out limited export routes.Exports through Newcastle port though have moved up to 102mt annualised but the assumption must be that this growth continues to be driven by met coal.
  • Data from Colombia confirms exports down 4.2mt ytd despite commissioning of new mines.
  • South Korean generators take 6.6mt of coal in September, up 19% yoy.

Bear news:

  • South African exports jump to 81mt annualized rate in October.Over the summer exports have been way below expectations since the port’s expansion from 72mt annual capacity to 92mt annual capacity was supposed to have been ready in July.This may signal the expanded facilities are now operational.
  • Indian inventories continue to build while buyers said to be out of market for 2009 deliveries…
What do you buy into market weakness? Big Oil… Big Cash

bp vs ftsee

The market has been using Big Oil and utilities (specially large caps) as sources of funds for their beta trades, especially financials and miners. I hear that short interest in BP is 12% of free float, for example.

As the mood in the market turns bearish and the concerns on balance sheets return to a market that forgot what net debt was, the focus, like in the past November, turns to real cash monsters.

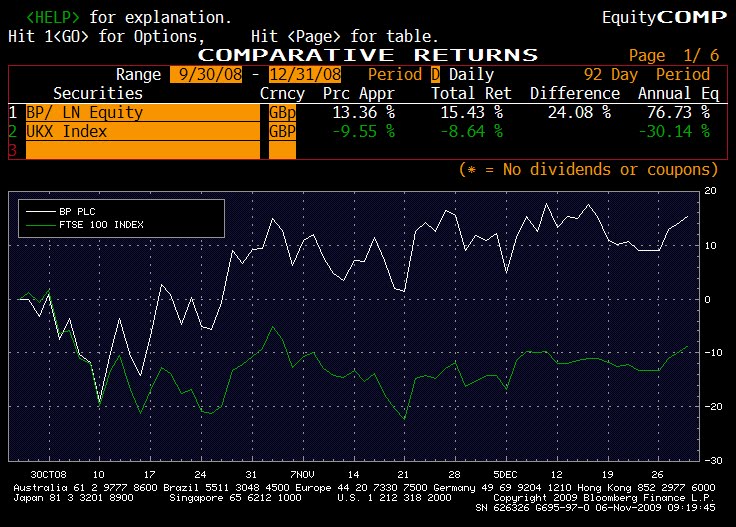
If we add to this that most of the market went short Big Oil after the 3Q results showed that growth was not appearing, and especially after lacklustre earnings from RDS and Total, we have a perfect storm. Last November, with oil going from $70 to $50 and the market disappearing downhill Big Oil outperformed the market by 12% into December.

Big Oil trades at 10x PE, 0.6x to the broad market (almost 15% from historical levels), generated 15% free cash flow yield last quarter (!!), delivers dividend yields that range from 6 to 7% and more importantly, has virtually no debt (Statoil 26% ND/Equity, BP 23%).

Into Megacap utilities, these have underperformed but now, ahead of 3Q in E.On and GSZ, the focus will turn back to free cash flow generation and balance sheet. Here the issue is that Enel, Iberdrola are massively debt constrained so the market opportunity is not as wide as in Big Oil (as utilities balance sheets are quite different, unlike in supermajors), so we are likely to see a move to real defensives, ie regulateds and megacaps.

The chart shows what BP did against the FTSE from Sept 08 to Dec 08 with oil falling and the market down.

Repsol’s challenge

repsol versus sxep

(Published in Cotizalia on Oct 29th 2009)

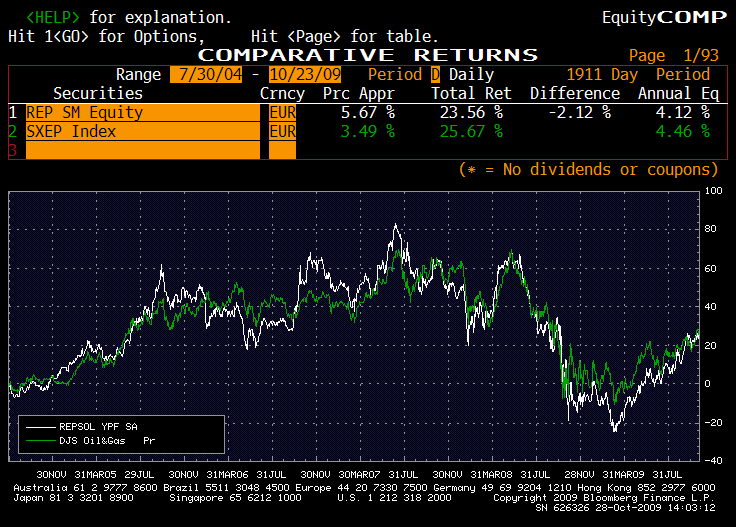
Interesting times for Repsol, with plenty of corporate rumors.

Since 2004 the company has focused primarily on controlling capex, in a group that needed to invest more than € 6 billion annually, almost 25% of its market capitalization to keep the net income flat, and find ways to sell YPF, trying to reduce the high exposure to Argentina, almost 40% of its assets. A similar problem to that of OMV in Romania, and to a lesser extent, BP with TNK (Russia). Still, the stock has behaved almost exactly with the rest of the industry, thanks to its exposure to Brazil, Venezuela, Sierra Leone and other assets of high exploration potential, which enabled it to be one of the few who will to replace 100% of its reserves in 2009. This despite the capital increase of Gas Natural Gas and Repsol’s Refining business unit, highly capital intensive and of low added value.

One hears rumors of a possible dividend cut, but this does not only affect Repsol. The industry tries to maintain a proper debt to the underlying asset, given its cyclical nature, can not afford adventures on its balance sheet. See the case of ENI, or OMV, with capital increase of € 1,000 million added.

The challenge of Repsol, and the integrated oil sector, is to create shareholder value, and that’s difficult in a sector as poorly differentiated. The integrated model has traded for years at 9-11x PE, with a discount on the sum of the parts which at the top of the cycle reaches 20% and at the bottom reaches 30%. A large discount to E&Ps or specialized services firms, for example, but also a lower-risk model due, in part, to the lower debt. It is difficult, as investor, to demand high multiples and dividend stability while seeking large investments and long term perspectives. More difficult, moreover, if Repsol requires € 3 billion per year in maintenance investments and € 15 billion to develop the fields of Brazil, since it has less margin than others, and needs high oil prices and refining margins much higher to generate free cash while developing these assets.

The stock appreciation of an oil company can only come from increasing the return on capital employed, which requires specialization and strict control of the return on investment, and crystallize value by separating assets. So it’s worth trying to sell YPF, refineries or Gas Natural with a premium, but it’s not easy, and political issues do not allow it in certain cases.

Repsol has before it the challenge of deciding what it wants to be in the next ten years. As British Gas or GALP are proving, it can not be in the whole energy chain at a time and maximize value in their growth areas. Controlling costs, develop the business of exploration and production, manage the portfolio of assets to avoid having more than 15% in each country, and reduce exposure to refining and regulated activities remains the appropriate strategy. If not, they must wait for the miracle of the expansion of multiples of the entire sector. And that is risky.

Oil and Nat Gas, two diverging commodities

oil vs gas

(Published in Spanish in Cotizalia on Thursday 15th Oct)

Oil has reached $80 a barrel. On the demand side, there has been an upward revision of estimates of the International Energy Agency, IEA and EIA. On the supply side, the fact is that in the last five years, increased investment in exploration and production ($220 billion per year), has not helped to replace 100% of the reserves consumed. Moreover, extraction costs are still too high and declines are affecting production in countries like Norway and Mexico, with falls of 6% and 3% respectively.

In natural gas, the situation is almost the reverse. The world has 60 years of life of proved reserves, which compares with fewer than 45 in oil, and to the estimate we must add large unconventional gas reserves. Proof of such excess is that in early 2009, British Gas decided to sell long-term 85% of its gas production expecting an environment of overcapacity in the medium term. Back then gas was trading at $ 7 per million BTU. Today is at $ 4.

On the demand side Eurogas expects zero growth in demand for gas in 2010, after a fall of 7% in 2009. This occurs while Qatar, Yemen and Australia, among others, are setting up more than 90 million additional tons per year of LNG capacity between 2009 and 2012. The projects in Qatar are competitive at $ 1.5 per million BTU, a level “only” three times less than the current one. This means nearly 9 trillion cubic feet per day of spare capacity. Um, does not look good.

As from 2013, the overcapacity created by excessive liquefied natural gas is reduced by lack of new projects. Since, according to international agencies, we will probably see a very moderate increase in demand in coming years, the supply of gas will remain ample. As for China, it can cover the vast majority of its gas demand with its own production, with the ability to have five times the current domestic production through its 756 trillion cubic feet of recoverable reserves.

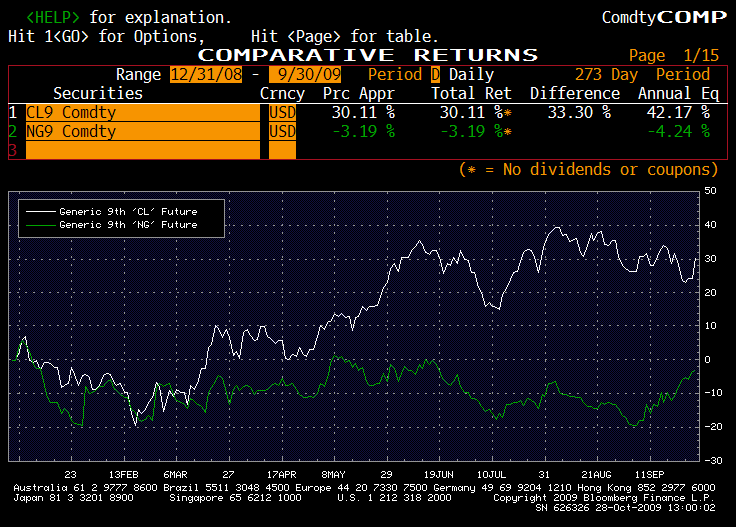
Interestingly, gas E&P stocks have performed in line with their of oil peers, although the oil price has risen by 30% and gas has fallen by 4%, showing the market is already anticipating a return of oil-gas convergence. I do not know on what basis. I just came from a few days with gas producing companies and the expected returns on their investments remain significant. Is that what investors buy? We’ll see if the results prove it and if valuations are justified.