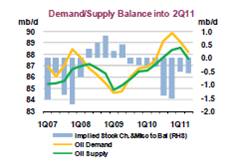
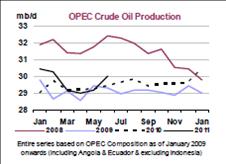
A) Oil demand is still above supply by c400kbpd but this could be short-lived if an OECD slowdown brings GDP estimates down by 2%. Given OPEC spare capacity is still at 5mmbpd and inventories in the IEA countries are in the upper range of the 2006-2010 average level, there is no small risk of entering an environment of oversupply if OPEC countries continue cheating on quotas (producing 27.5mmbpd versus 24.5mmbpd quota).
Tag Archives: Energy
Peak Oil?… Demand Weak Again, Supply Concerns Overdone
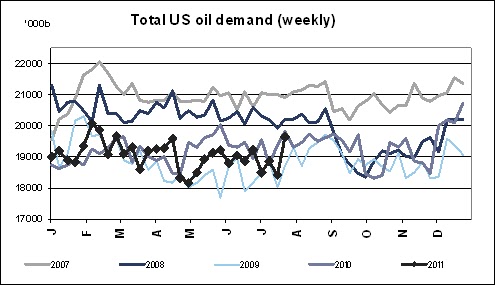
As we have said in this blog, over and over, IEA and consensus estimates of oil demand growth were too optimistic.
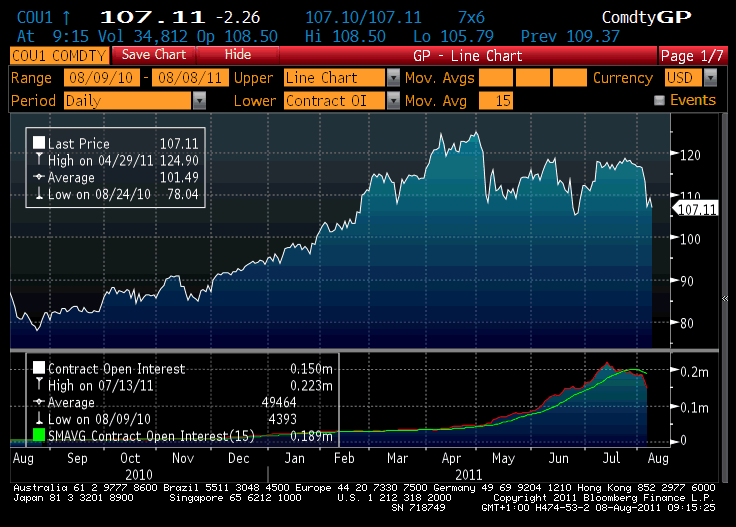
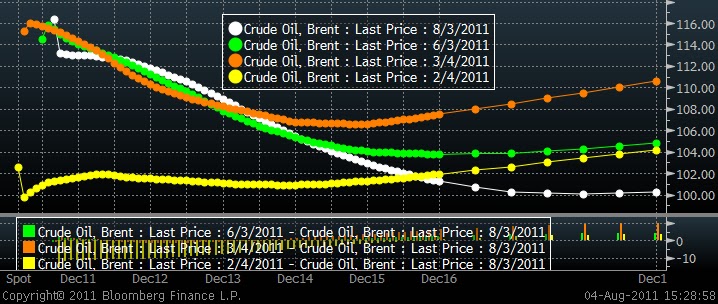
Now we have the proof. See the chart above. Oil (Brent) has gone from steep contango to a deepening backwardation in six months. What’s more important is that the backwardation has deepened as the Libya conflict intensified and prolongued.
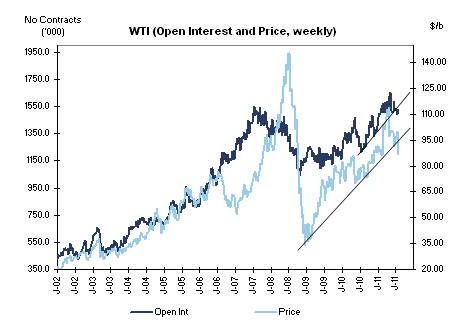
Additionally, net length from financial investors is healthily slowing down. The latest change in the crude position reflected a sharp reduction in Managed Money net length (~23k contracts) but overall positioning remains towards the upper end of the historical ranges.
And this happens as the Oil markets puts 158 projects close to end of pipeline that target 11mm bpd of supply.
If we add to this that Venezuela and Iran are pushing for higher quotas (see my article about it) and Saudi Arabia is pumping 600kbpd more than in January, we have the same recipe as in 2008… a financial crisis and a supply response that comes too late.
Is this financial crisis due to the high oil prices, as some argue?. No, this time it isn’t. The OECD debt crisis comes from the massive stimulus packages and printing money. Oil strength has not been a cause this time. It has been a consequence.
With EU countries running at 120% of debt to GDP in some cases and the US at 100%, the austerity measures and cost savings that we will inevitably see will bring GDP growth down. And 1% cut in global GDP means $10/bbl on oil prices, with or without Libya.
As China looks to reduce inflation and sees its banks running their own debt issues, we will also see a reduction of Asian demand.
Therefore, a simple calculation leads me to believe that OPEC spare capacity can rise back to 6mmbpd only on a 0.3% global GDP revision. If global GDP growth estimates fall by 1%, this spare capacity would rise to 6.8mmbpd at the same time as Iran, Venezuela and Saudi Arabia look to increase output by 300-600kbpd each.
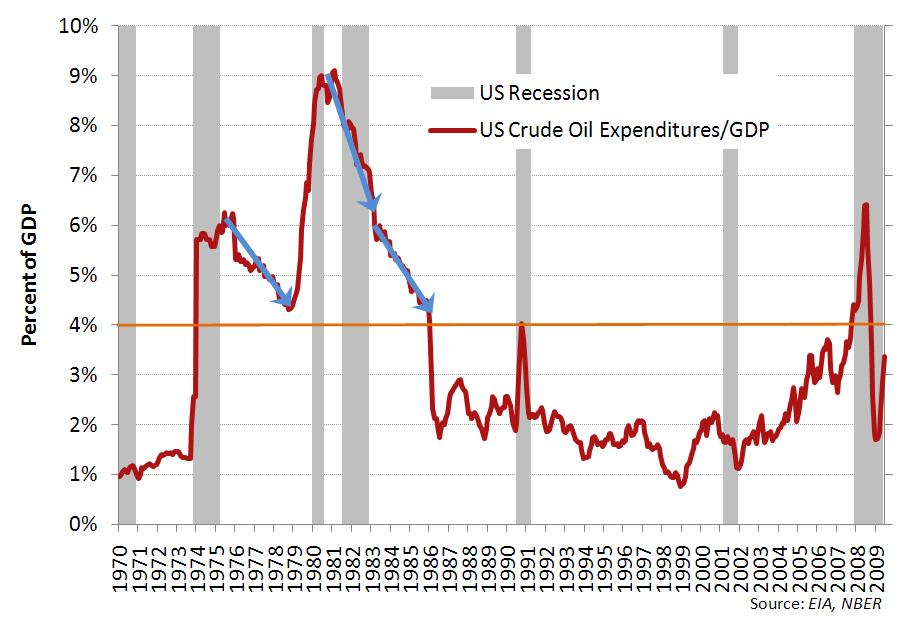
The good news is that an oil price closer to $100/bbl will be equivalent to an entire QE2 on the economy, so the fear of recession might be offset by lowering energy prices. And obviously, in the US that situation will continue to be more benefitial for the economy as WTI differenctial is expected to remain at the $15/18/bbl level to Brent (see my article here).
http://energyandmoney.blogspot.com/2011/06/china-slows-down-as-saudi-arabia.html
http://energyandmoney.blogspot.com/2011/06/iea-releasing-strategic-reserves.html
http://energyandmoney.blogspot.com/2011/02/brent-wti-spread-more-fundamental-than.html
Natural Gas Vehicles… An Interesting Alternative
But the second I’m more interested in. Natural gas cars . The companies exposed to this sector soared in the stock market on the news that the U.S. government (if it survives) will keep the tax deduction for these vehicles. But the interesting thing is that, even without tax grants, converting vehicles to natural gas is attractive.
The advantages of the natural gas vehicles are:
– Access to an abundant source of energy, six times cheaper than oil . Even after all costs, the difference between diesel or gasoline and natural gas in the U.S. is 2 to 1.
– Very low infrastructure needs . Compared to the trillion dollars needed to adapt the country for electric car infrastructure, the U.S. already has converted service stations in almost all states.
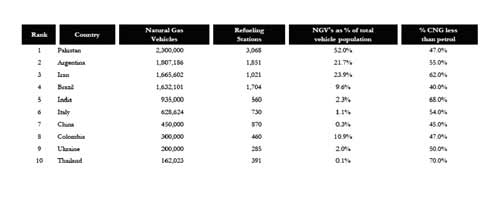
– It’s a proven technology for vehicles of all types of tonnage. In Brazil, for example, 9% of the fleet runs on natural gas liquids.
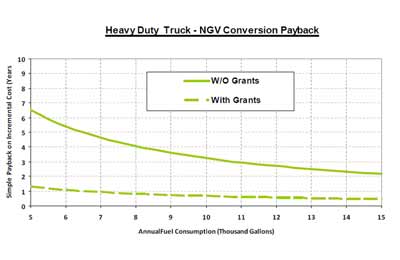
– Does not require subsidies . A truck that consumes 15,000 gallons of gasoline a year saves $ 22,500 a year in fuel and recovers the cost of converting to natural gas in 2.9 years. If tax deductions are not approved, it would recover the investment in 4.5 years.
– They are not ugly like crazy. Unlike other unconventional vehicles, they do not need to look like clones of the Atom Ant helmet to have the autonomy of a traditional car.
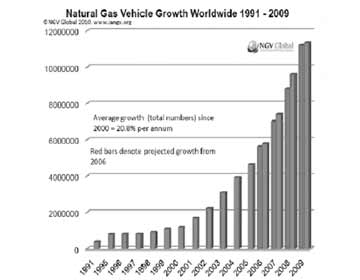 T. Boone Pickens , the billionaire American, has been saying it for a long time. It makes no sense to keep the huge fleets of trucks travelling up and down the U.S. using gasoline/ diesel when the country imports $ 1 billion per day of oil from foreign sources, while the US produces abundant natural gas cheaply and with a local industry.
Therefore, in a country where, thanks to shale gas the industry can benefit from abundant natural resources, low prices and a daily production of 58-60 Bcf / day, it makes perfect sense to convert a substantial portion of the fleet from gasoline to natural gas.
But most importantly, if we assume that these vehicles, the same way that electric cars, absorb 9% of the total fleet, the additional demand in 2020 (2.5 Bcf / day) would be less than 3% of the domestic production of natural gas, making the price impact of additional consumption quite limited.
Disadvantages of the natural gas car in Europe:
– In Europe we still reject to develop our reserves of shale gas, as we stated here , so the cost benefit may be lower, since the country depends on gas import from Russia, Qatar and Algeria, for example. However, even assuming the price of gas in Europe (NBP), which is two times more expensive than in the U.S., the savings compared to petrol or diesel is still relevant (38%).
– In Europe almost all countries have near-monopolies on natural gas, some state-owned, with market shares by country ranging between 60 and 80% (E.On-Ruhrgas in Germany, GDF- Suez in France , ENI in Italy, Gas Natural SDG in Spain , Galp in Portugal ) which prevents strong competition. In the U.S. there are hundreds of independent companies and none has more than 15% market share. Even after the merger of ExxonMobil with XTO the group only has 12% market share in gas.
– In Europe, unlike in the U.S., the final price of gasoline and diesel include between 55% and 60% tax . If you apply a similar tax to natural gas, and believe me it would happen, say goodbye to the benefits of conversion. But that risk, intervention and government hands in the consumer’s pocket, is going to happen in every technology, electricity included.- The main disadvantage is that if demand soars for electric cars, hybrids and natural gas vehicles, added to the “start-stop” engine that giving an additional 15% fuel efficiency, then demand for oil will collapse, making the price of crude more competitive. Obvious. But in principle, assuming a 10% penetration of the fleet in the OECD in “unconventional” transport, it seems that the impact on oil demand will not be greater than 3% overall.
What I love to see is more companies, from my dear Better Place (Israel) in electric vehicles, to EQT, Westport Innovations, Clean Energy Fuels Corp. and others in the U.S., whose business model is already beginning to sound very promising when it includes the sentence “without subsidies.” That’s enough to get me interested.
Data Source: Clean Energy Fuels, NGV, Lazard, Exxon, EQT
Further reading:
http://energyandmoney.blogspot.com/2011/05/who-killed-electric-car.html
http://energyandmoney.blogspot.com/2009/12/observations-on-arrival-of-electric-car.html
http://energyandmoney.blogspot.com/2011/07/european-crisis-falling-demand-and.html
http://energyandmoney.blogspot.com/2011/06/shale-gas-in-europe-poland-and-energy.html
Integrated Oils. Break-Up or Fade Away?
Integrated oil companies don’t create value for shareholders. This is the unanimous cry of investors.
The conglomerate discount at which the sector trades has now reached record levels (between 20 and 40%) and quarter after quarter investors see that the supposed benefits or synergies of agglomerating refining, exploration and production, gas and electricity and various renewable adventures are seen nowhere in the returns and certainly not in the share price.Of course, we continue to see slides where companies applaud themselves for being “large”. Large conglomerates of many capital intensive businesses with poor profitability. Because today we do not see the benefits or improved competitive position with respect to independents either in growth or relationships with producing countries. Big Is Not Beautiful .
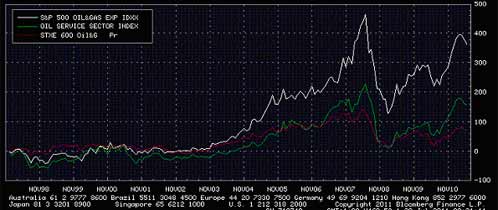
“Long term, Lacalle, these are long-term investments.” I hear. Well, long term investors have not been rewarded at all. The European integrated oils (red line on the chart above) since 1998 have performed quite poorly while oil rose from $14 to $114/bbl. Meanwhile, independent explorers rose c300% (12% annually) in the U.S. (white line) and 500% (20% annually) in the UK. Furthermore, the oil services companies (green line) rose 155% (7% annually). For reference, I remind of my posts on oilfield services and independent explorers.
With oil prices increasing almost tenfold, the integrated European sector average performance since the end of the mega-mergers, 1998, has been a paltry 3.8% annually. Considering they have paid a dividend yield in that period of between 3% and 6% and assuming that such dividends were reinvested, the real stock market performance has been almost equal to inflation. Destruction of value of spectacular size.
But it’s even more impressive to see how terribly the integrated Europeans have performed (+3.8% annually in dollars) compared to the Americans (+7.6% pa) since the days of mega-mergers.The reason, sad to say, is that the Europeans have generated an average 12-16% ROCE due to the “diversification” into many low-return businesses, while Americans were generating a 18-23% ROCE. In Europe, poor refining investments (remember “the golden age of refining” bet?) and adventures out of the sector from renewables to power and healthcare, telecoms and nuclear, have “eaten” the profits of exploration and production. Investing in refining in Europe is a donation, not a business.
It’s a shame, but many of the European oil majors are semi-state political vehicles where the alignment of interests between shareholders and managers is very low. As an example, using data from annual reports, we find that European managers have virtually no shares in their companies (less than 0.01% of capital), compared to 6% on average in the U.S., apart from the giants Chevron Exxon or Conoco (between 1% and 1.2% of capital). People tend to work harder if their own money is at stake, and if a CEO has more desire to become a minister than to see shares go up, his actions will lead to his principal goal.
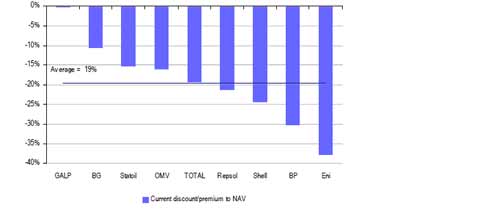 No wonder, then, that ROCE driven companies outperform. Exxon just trades at a 4% discount compared to the sum of the parts of its businesses, while Chevron trades at a premium of 4%. On average, the listed American integrateds, according to UBS, trade at a discount of 5-8% while ENI (Italy, semi-state) trades at a 38% discount, OMV (Austria, semi-state) at 16%, Total (France, private but with strong public ties) at 22%, or BP (private but a “flagship company”) at 30%. Repsol, which emerged from the “Argentina trip to hell”, used part of the philosophy of Marathon (either by choice or necessity or shareholder pressure) has cut its discount from 40% to 20%. But it still has much to do to be remotely similar to Murphy or Marathon and it is important to remember that maintaining control positions in listed subsidiaries does not help because the conglomerate discount remains.(source: UBS)
We recently explained why the integrated sector does not work in the stock market , but what would happen if they broke into parts?. Let us focus on the possibilities of a break-up to create value:
1) Not all have to. As we have seen, American integrated trade at a small discount or a premium to their sum-of-the-parts, thanks to the ongoing evaluation of their business portfolio, and having no mercy when it comes to divest in areas of low profitability .
2) Not all can do it . In order to do a successful break-up companies need to start with a powerful exploration business, with high growth that would trade at a strong premium and a very strong refining and marketing business with strong cash flow and good EV/complexity and margins so that investors value them. Marathon and Murphy are companies that have exploration and production businesses that can trade at higher multiples, but also very successful in refining so it is easy to separate them.
In the European case it is more difficult because usually companies “limp” in one division or another. They are also companies with more “surprise invested capital” (a lot of hidden diversification with low returns) and thus this could lead to a separation at very low multiples. For example, despite having a world-class exploration and production business, Total’s refining + marketing + renewables, which has generated losses in France since 2001 as the CFO acknowledges, could not be separated. If Total, for example, could not close the refinery in Dunkirk, losing millions a month, could Repsol sell its inefficient refineries given the same pressure from local governments?
BP, for example, also has a powerful exploratory heart, but very low growth (Thunderhorse, etc) and average exploration success, and is still trying to sort out its disastrous Russian adventure (TNK, 20% of its reserves), sell their underperforming European refining and reduce exposure to its renewable business at a time where renewables are falling in valuation every day. If it separated its activities in three, as some propose, these would very likely trade at sub-peer multiples as well.
There are also many pressures and core-shareholder policies that prevent companies from selling non-strategic assets. From ENI with its subsidiary Snam ReteGas and Galp, to Repsol and Gas Natural, which at some point traded at €40/share when it was a possible candidate to be sold, yet now trades at €14/share after a massive acquisition and a capital increase.
Furthermore, disposing of those assets would probably show to investors that the alleged “high growth” E&P division is probably not going to trade at the multiples of an independent explorer given the fact that, at the core, in most integrated oil companies, the exploration success ratio is well below that of independent companies, the reserve replacement is lower and they are not takeover candidates or sellers of assets, just aggregation vehicles.
Separation has only proven to create value for all stakeholders (shareholders, industry, country) when the parts are true growth and value, as the model of BG and Centrica showed, which delivered two strong national companies without massive conglomerate issues, lean operations, higher ROCE and clear market valuations. This made them also bigger and better companies.
3) Not all should. One should ask – sell and separated to do what? Sometimes you have to be careful what you wish for. When some of these companies are separated, the excess cash is often used to make acquisitions, and given the examples of the past, it is sometimes better to stay with the devil you know.
Example: If ENI dispose of Snam it would lose €2.5 billion in operating profit.As an industrial and semi-state owned company, it would seek to acquire something that would replace that figure. And would probably be more expensive than the asset sold. Unless those gains are reinvested in buying back shares, pay dividends or make one acquisition of very obvious high value, the benefit may be non-existent. So the only way to create value is to forget trying to reinvent the wheel and focus their efforts on growth in exploration, an area where their returns and competitive advantage are obvious.
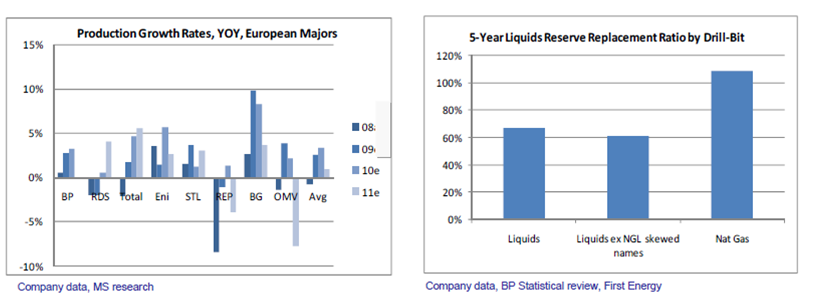
The illusion of value in Euromajors’ E&P businesses is another contention issue. If we look at European majors’ E&P business from the perspective of an independent upstream company, here is what we find: No real organic reserve replacement (most of it is acquired), sub-standard growth (1-2% pa at best), very exposed to OPEC, gas and non-conventional resources, exploration success below-E&P standards in past five years at less than 35% (versus E&Ps at 56%), low ROCE (15-17%), bureaucratic and slow management decisions. But most important, a major’s E&P business, even if restored to industry standards, is not for sale as they are asset aggregators, so it would never be valued on a NAV basis like other E&Ps. See the example of Statoil, which is now a pure play E&P, has no conglomerate problems and still trades at 16% discount to sector.
The only upside from integration is size and scale. By staying combined and being huge $100bn+ companies, the majors force the market to value them on P/E, and dividend yield rather than being subjected to the scrutiny of production growth, ROCE, reserve replacement etc and EV/complexity adjusted barrel, margin, cash-flow etc that smaller pure play peers are subjected to in upstream and refining.
The weakness in the theory of break-up value as a strategy is that by splitting up they subject themselves to a comparison of their individual businesses vs peers, and the comparison is bound to be poor on growth, on exploration upside, cash flow and ROCE. So it seems that majors are happy to complain about their share price, but prefer to continue to mask poor strategic and operating performance vs independents by staying “too big to ignore”.Ultimately, as we said a year ago, be wary of promises of value based on estimates of sum-of-the-parts. Because it ends as a text-book case of “value trap.” And let’s welcome focused strategies. At the end of the day an oil is not an NGO, it’s a “capital allocator” which should review its portfolio of businesses each year and cut off mercilessly the areas of low profitability … As Shell has begun to do since Peter Voser beame CEO. And forget the “long-term value” mirage. As Exxon says, there is no long-term strategy that cannot be monitored from quarter to quarter. Size does not matter unless it creates value
http://online.wsj.com/article/SB10001424052702304537904577277440911481180.html
