I just came back from a trip to New York and investors concerns about energy and oil prices were clearly at the top of the agenda.
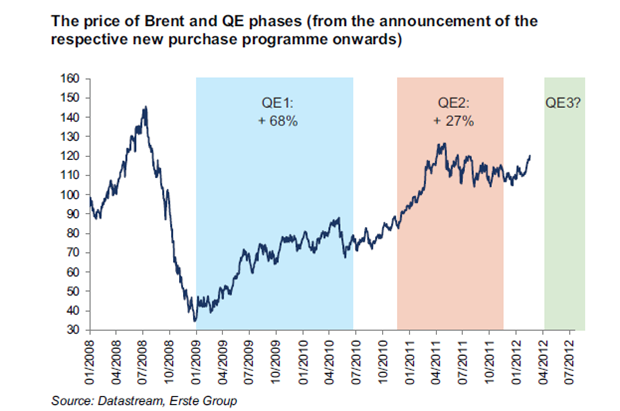
Who’s to blame for the current oil price?. Supply? demand?. Mmmm. I have a feeling that the blame this time is on Mr Draghi and friends in UK, Norway, Australia, US, with the ongoing mass liquidity injections and QEs, all driven to generate inflation one way or another, and driving investors to increase net length in crude.
Oil prices reached all-time high in Euro and in GBP last week. All US media is mentioning high gasoline prices and it’s a permanent fixture in Europe news. If sustained, the price increase since December could trim 0.25-0.5% from annualized real GDP growth over the next year. Moreover, the combination of a stronger world economy, massive liquidity injections and quantitative easing programs with increased tensions in the Middle East suggest that a bigger shock is less of an issue than in the past.
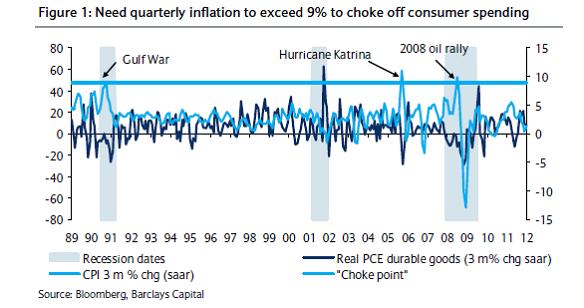
Barclays highlights that “it is not necessarily the oil price itself that can pose a threat to economic growth but the pace of its growth that is more important. It is the sudden surge in oil prices that leads to an abrupt shock to consumer spending and economic growth. Consumer durable spending, the most sensitive component of spending, fell sharply when the 3-month annualised change in headline inflation exceeded 9%. In each case, the price of oil rallied in excess of 40% over a 3-month period. In contrast, the latest geopolitical fears have, so far, led to a 20% rally in oil” …and inflation is way below 9%, at 3-5%.
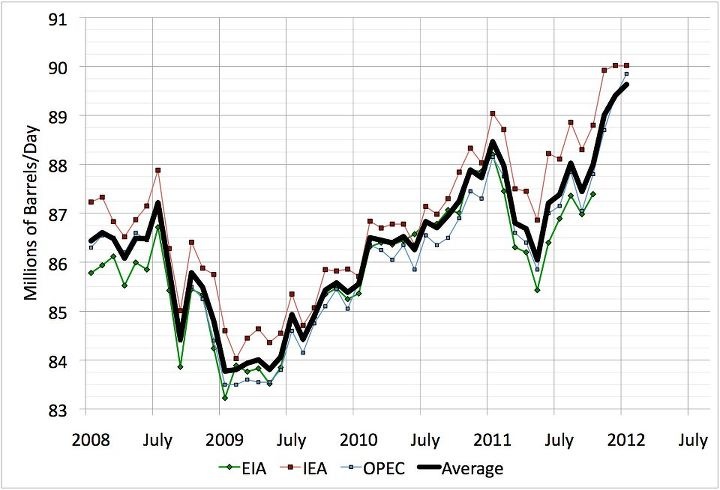
Let’s start with supply. Global oil supply, despite Iran, Syria and Lybia is at record levels. Not only Russia and other producers are keeping the pace strongly, but OPEC is producing at all time high, as per the figure below:
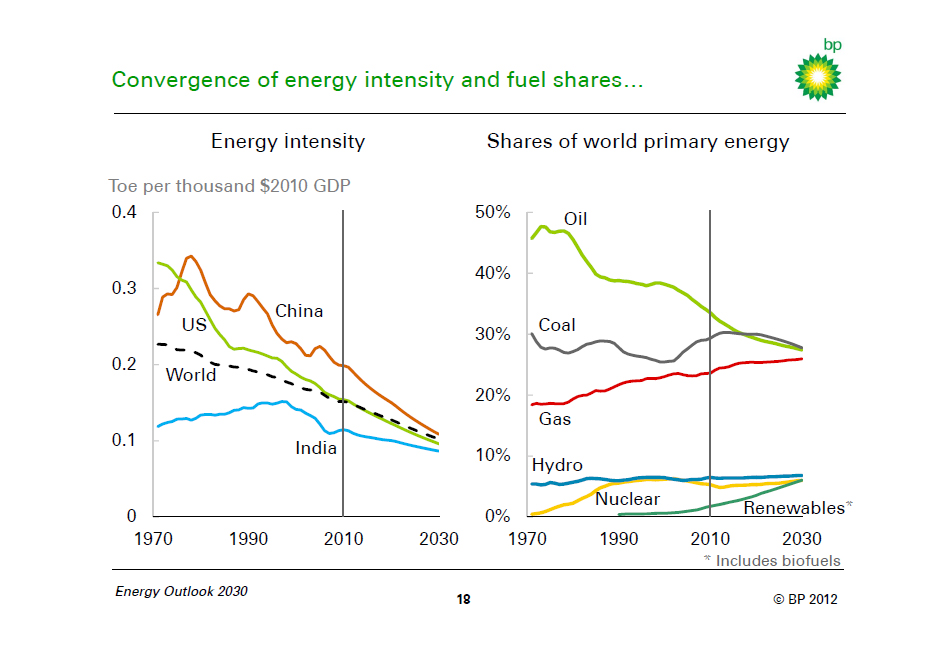
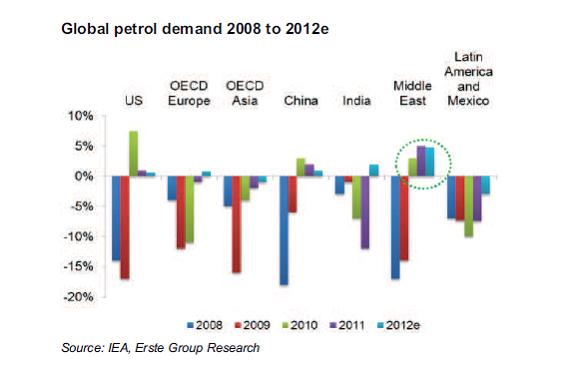
What is interesting is that, outside of the Euro crisis, the world’s economies are behaving much more strongly than expected but oil demand is not reacting. Efficiency comes to the fore. What many call “weak demand due to crisis” is in many cases, US being the clearest, a relentless improvement of efficiency. See below:
|
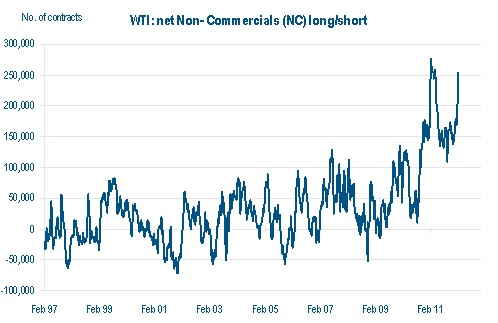
CFTC Non-Commercial long/short net positions (21st February)
|
CFTC MANAGED MONEY net positions (21st February)
|
ICE Brent long/short net positions (14th February)
|
|||
| Crude |
228,180 (prev 204,752)
|
215,802 (prev 202,222)
|
Non-Commercial |
105,901 (prev 93,673)
|
|
| Nat Gas |
-124,929 (prev -126,157)
|
-70,832 (prev -72,314)
|
Managed Money |
96,703 (prev 88,706)
|
|
| Gasoline |
90,298 (prev 87,696)
|
91,640 (prev 88,575)
|
|||
| Heat Oil |
27,566 (prev 23,544)
|
43,207 (prev 39,379)
|
|||
One of the areas that interests me the most is the growing net long interest in crude, reaching levels close to 2008. The inflation trade is on and the carry trade is guaranteed by the insane monetary policy and low interest rates “for the foreseeable future”.
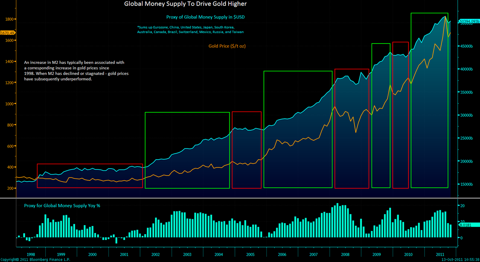
Think about it. Monetary supply is growing so fast, from China to Europe, because the developed world is worried about deflation, that we cause inflation in all commodities (except regional and local ones like US natural gas). The balance sheet of the ECB has multiplied by 3 since June. Monetary supply is twice as high as it was at the end of the past decade.
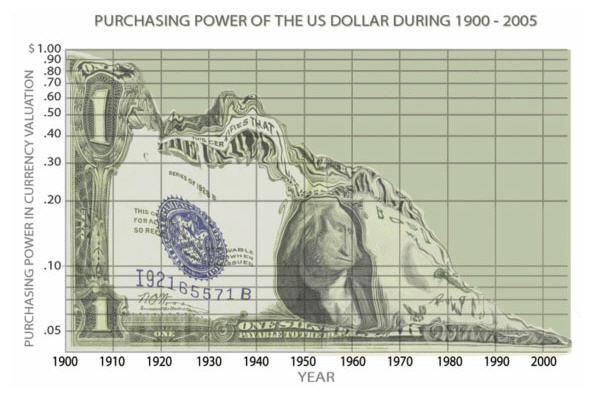 According to seeking alpha (see link here): “Developing China’s M2 money supply has been rising by a large 20% and Russia’s by a very large 30%.Even developed countries such as Switzerland have seen money supply growth of 25%. Japan’s M2 is gradually moving higher after the ‘Lost Decade’ and after recent events exacerbating an already fragile situation. Global money supply growth is increasing by 8%-9% per annum”.
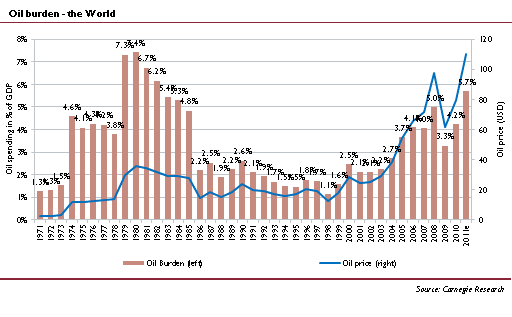
Then we go to the issue of “the oil burden” or the import bill versus GDP. It’s currently close to 5%, but the share of the oil burden in the OECD is diminishing, making high oil prices less risky for the recovery. Meanwhile, in emerging markets, high oil prices are also a less of a problem as the oil consumption generates products, goods and services of much higher productivity and higher added value. Remember that most emerging economies do not “need” low oil prices, that is more an OECD construct. Those economies have lived with high energy prices for a long time. When the oil burden reaches 7% is when we can start to worry. So far, demand destruction is a concern but not a worry.
The IEA March report left 2012 oil demand forecasts unchanged, but highlighted OPEC’s ability to increase production, with OPEC volumes at the highest level since October 2008. OPEC supply in February was 1.3Mbpd ahead of the forecast call on OPEC for 1Q.
OECD inventories rose 13.6Mbbls in January and fell 26Mbbls less than usual in Feb. Furthermore, the IEA sees 625kbpd extra OPEC capacity by 3Q, adding to current spare capacity at 2.75Mbpd (Bernstein).
Here is my interview on CNBC:
http://video.cnbc.com/gallery/?video=3000076989
Worth a read:
http://energyandmoney.blogspot.com/2012/03/energy-disinflation-as-source-of.html#
