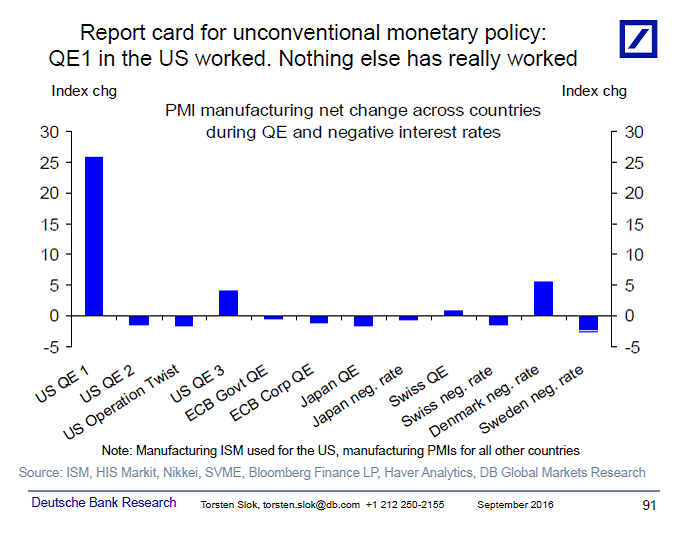
- In eight of the 12 cases analyzed, the impact on the economy was negative
- In three cases, it was completely neutral
- It only worked in the case of the so-called QE1 in the US, and fundamentally because the starting base was very low and the US became a major oil and gas producer.
“How do you evaluate if QE and negative interest rates are working? When I discuss this with clients, I sometimes get the response that QE and negative interest rates are working well because the payment systems are running and the financial system still functions. But the issue is not if computers can deal with negative interest rates. The issue is if QE and negative rates have been supporting the economy.The chart below looks at QE and negative rates across countries and the impact it has had on ISM and PMI across countries, from start to end of each unconventional policy. The conclusion is that US QE1 had an impact but in all other cases the impact of QE and negative interest rates has been insignificant. And in 8 out of 12 cases, the economic impact has been negative.
Once again, there is too big of a burden on monetary policy and it is time for fiscal and structural policy to step up and begin to support GDP growth.”
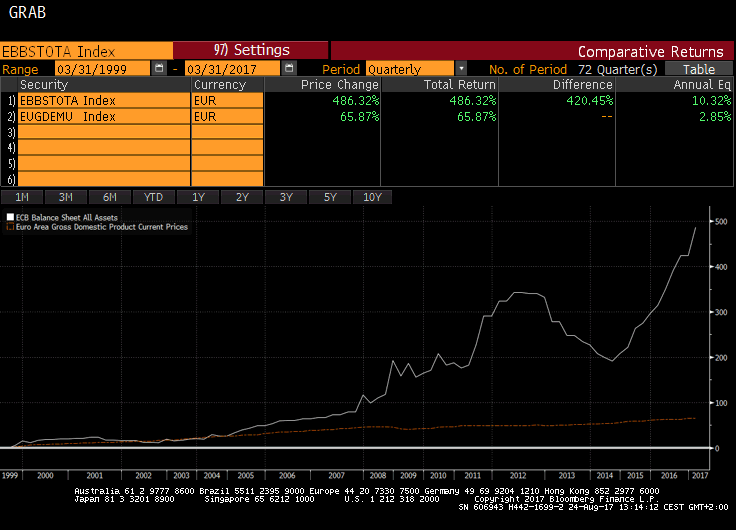
The European case is truly amazing (growth vs central bank balance sheet):
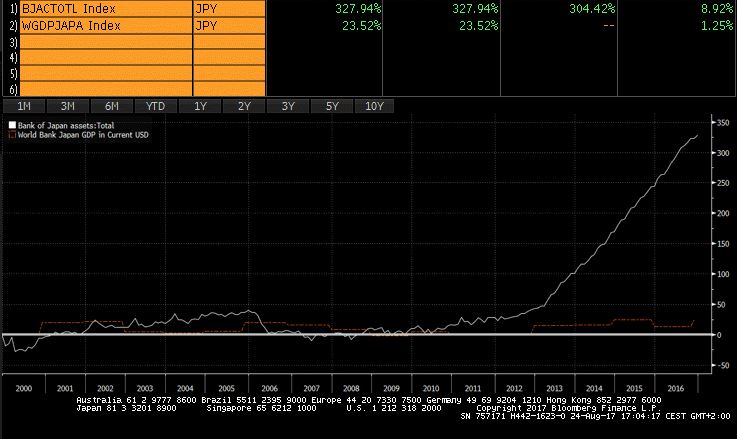
But the Japanese one is simply staggering:
Central Banks Balance Sheet vs Global GDP
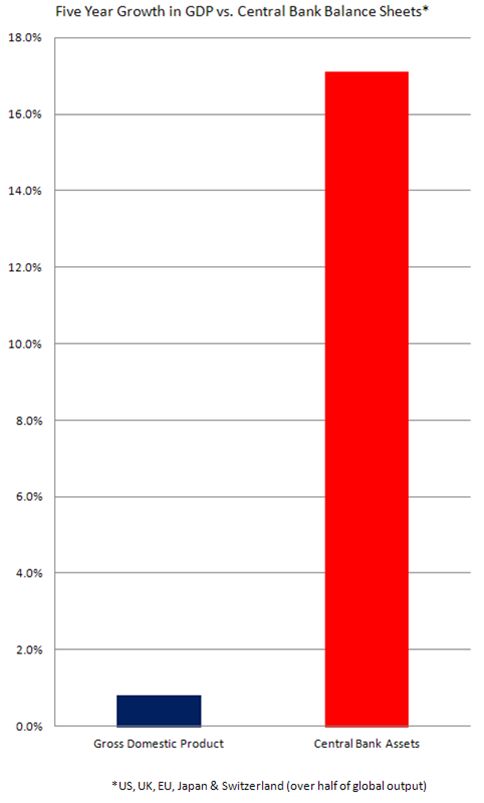
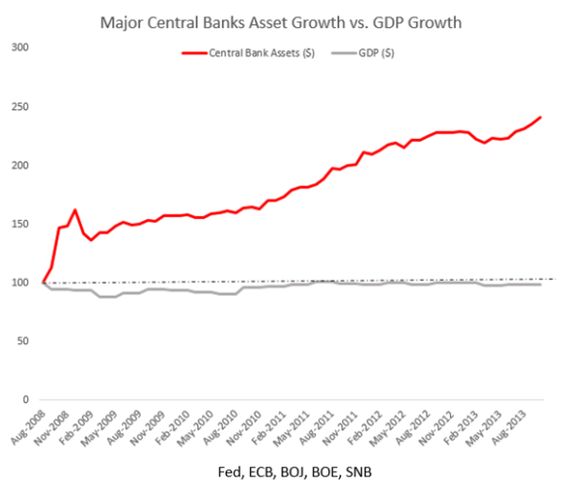
Last two charts via @dailyeconomist
A very thorough analysis here: “Current Federal Reserve Policy Under the Lens of Economic
History: A Review Essay”.
“Further there is no work that establishes a link from QE to the ultimate goals of the Fed, inflation and real economic activity. Indeed, casual evidence suggests that QE has been ineffective in increasing inflation. For example, in spite of massive central bank asset purchases in the U.S., the Fed is currently falling short of its 2% inflation target. Further, Switzerland and Japan, which have balance sheets that are much larger than that of the U.S., relative to GDP, have been experiencing very low inflation or deflation”.
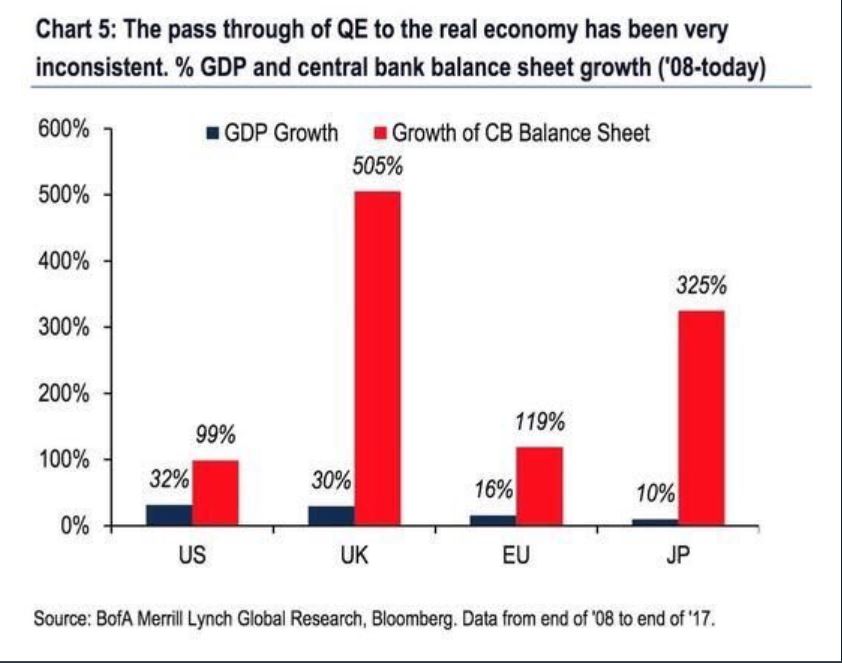
Merrill Lynch also shows the poor QE results:
Daniel Lacalle is a PhD in Economics and author of “Life In The Financial Markets” and “The Energy World Is Flat”
#slowdrown @stimalus
Of course. Remunerating IBDDs is contractionary (destroys money velocity depending upon the level vis a vis non-bank wholesale funding, aka Reg. Q ceilings). Countercyclical capital cushions are contractionary (destroys the money stock $ for $).
The economy reversed when money flows reversed in March 2009 (as it always has for the last 100 years).
Bankrupt-u-Bernanke should be in Federal Prison.
I don’t understand the last graph? If the Fed balance sheet went from $800Bn in 2008 to $4.5Trn today, thats a growth of 562% not 99% shown. Can you explain please. The BoE looks right but the EU seems low too.
Or am I reading this wrong? Thanks
Hi, the graph puts the growth in balance sheet since the central bank launched repurchase programs, and net of disposals. Thanks for the comment
About a week ago there was an online discussion of central banks and gold as a reserve asset which prompted me to do a search using ‘central bank gold purchases chart’ in hopes of finding current and historical charts. Going several pages deep in my google search and findings makes me wonder about the role of what has been an apparent hoarding of gold by central banks since the last crisis of 2007/08.
What are your thoughts on central banks acquisition of gold in the quantities that came up through this search and am I wrong to think they have been doing so in a well calculated anticipation of mitigating effects of a bigger economic crisis?
Thank you!
Not really, in my opinion central banks tend to buy gold and foreign reserves based on a general view of asset diversification. Their entire purchases of gold in this period amount to a tiny fraction of money supply, so they are not preventing or preparing themselves for much.
Thank you for your insight. The volume over time appears very large at first glance!