Yes, friends, if EROEIs of unconventional and new oil production were as low as some defend, the industry would simply abandon those resources.
Peak Oil defenders continue to make new claims. While inventories reach the highest levels of the past five years, OPEC fights to keep quotas and for a third consecutive year reserve replacement remains strong, in a world that has not seen a single day of disruption in oil supply, the defenders claim that the problem is EROEI (energy returned on energy invested) and that therefore, it doesn’t matter if supply is abundant, because it is still negative.I had the pleasure of talking with industry leaders and this is their response.
 a) The concept of EROEI has to be clearly attached to profitability. Peak oil crash defenders scream at 4:1 levels as unsustainable. This is funny. An “alleged” low EROEI is not necessarily a negative in itself, given that low cost of capital and high technology developments have helped to have readily available and abundant energy all over the energy complex (not only in non-conventional, but in conventional resources), and there has been no issue with supply in any environment despite a few geopolitical bumps. Furthermore, that EROEI rises as efficiency and productivity help reduce power use and increase output.
b) The concept of EROEI is static, it uses an estimate of energy consumption that starts at an intensive point and that just stays or rises afterwards, and this has proven to be wrong (energy used per unit produced falls dramatically in virtually all industry projects, see Shell’s analysis of oil sands extraction).
c) If EROEI estimates published by peak oil defenders were correct, given the gigantic increase in E&P and non-conventional spending we have had, power usage, and electricity prices and gas prices would have rocketed… But they have fallen. Co-generation is barely considered by EROEI doomsters either.
More importantly, in projects as energy intensive as PNG LNG, cost of energy used has fallen by 34%.
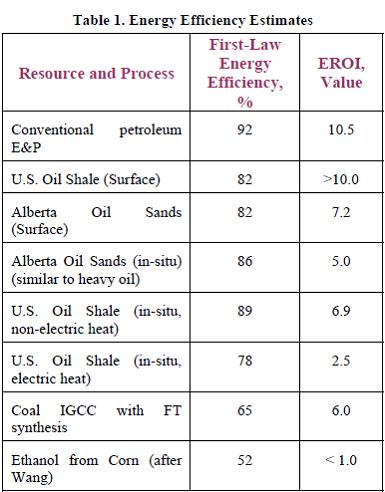
In Oil sands we have seen drops of 25% per unit of production. In shale oil as dramatic as 34%. The graph below shows the EROEI estimates of the Department of Energy in 2006 (link here). This was in 2006. Since then the efficiency and lower use of power and energy in hydraulic fracking and oil sands extraction has significantly increased the EROEI.
d) EROEI is an excuse of peak oil defenders to justify that they have been wrong about supply, turning the debate to the alleged unsustainability of that same supply as a justification.
Finally, any of the peak oil defenders needs to explain how the development cost of the industry has fallen, the energy intensity of the industry has gone down dramatically (they don’t read companies sustainability reports?) yet reserves and production have improved 2006-2010, fundamentally in unconventional.
The EROEI theory takes an individual projection (and this is typical for peak oil), leaves the negative elements untouched and stable (as if techonology and resource development did not improve) and then expands it to the entire base.
This, obviously, leads to a massive generalization and a leap of faith that can be easily denied just looking at 20-F filings, detailed analysis per project, which are available to all shareholders in strategy presentations and Fact Books, and in the brutal fact that oil sector’s electricity and gas consumption has been falling while productivity, particularly in non-conventionals, has soared.
Never bet against human ingenuity.
Further read. The Oil Drum (link here):
On EROEI of oil sands
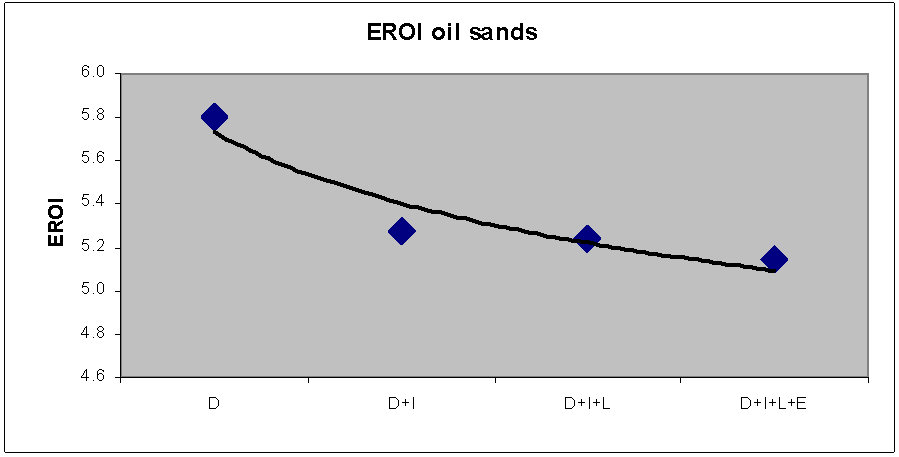
“EROI depends mostly upon the direct energy used and which alone suggests an EROI of about 5.8. Including indirect energy decreases the EROI to about 5.2”, “adding in labor and environmental costs have little effect”. “Nevertheless it appears that tar sands mining yields a significantly positive EROI”.
On shale oil “Reported EROIs (energy return on investments) are generally in the range of 1.5:1 to 4:1, with a few extreme values between 7:1 and 13:1”. “Tar sands and oil shales seem to be in the same EROI ballpark”.
 Note from Daniel Lacalle: Worth noting that the assumption of energy consumption in the article for shale oil is now widely seen as excessive, so real EROEI is currently close to the latter part of the analysis (7x to 13x)
Further read:
http://energyandmoney.blogspot.com/2009/11/peak-oil-realities-myth-and-risk.html
 a) The concept of EROEI has to be clearly attached to profitability. Peak oil crash defenders scream at 4:1 levels as unsustainable. This is funny. An “alleged” low EROEI is not necessarily a negative in itself, given that low cost of capital and high technology developments have helped to have readily available and abundant energy all over the energy complex (not only in non-conventional, but in conventional resources), and there has been no issue with supply in any environment despite a few geopolitical bumps. Furthermore, that EROEI rises as efficiency and productivity help reduce power use and increase output.
 Note from Daniel Lacalle: Worth noting that the assumption of energy consumption in the article for shale oil is now widely seen as excessive, so real EROEI is currently close to the latter part of the analysis (7x to 13x)