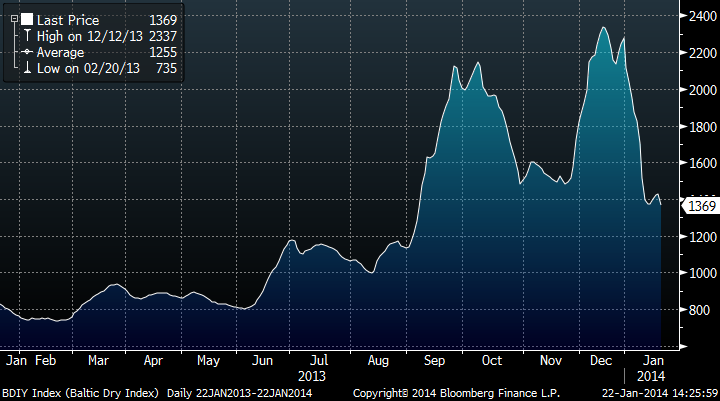
The big moves seen in the Baltic Dry Index falling aggressively (down 52% YTD and back to September levels) have come from a combination of:
– . Capesize rates have fallen 48% in a week to $17k per day. This has been driven by spot chartering falling to 72 vessels relative to the highs of 161 vessels chartered seen at the peaks in December.
– . Iron Ore imports are on hold after stockpiles in major Chinese ports have gone to 82mt versus 71mt average in 2013. Chinese crude steel output has fallen driven by pollution control measures as well.
. Panamax rates have fallen 7% in a week due to the suspension of Colombian coal shipments until March by Drummond, the world’s 4th largest coal exporter.
– . Crude tanker rates (VLCCs) have fallen 28% in a week to $30k per day, as vessels to the US are reducing given lower imports.
These moves justify the decline back to September levels, as the previous increases arrived from short term big rate improvements driven by re-stocking in India and China and an increase in refinery utilization –and oil imports- from the US.
In essence, rates are returning to a normalized level of small improvement from the lows but a shipping environment that is still oversupplied and global commerce is not improving drastically, and definitely not even close to 2007 levels.
The moves up in rates in October-December were driven by one-off events that drove to a short-term tightness in very particular segments (Capesize and Panamax).

One thought on “Baltic Dry Index Shows The Global Economy Is Not Moving”