If we look at the list of key macroeconomic data published in recent weeks, we can not use a better definition than “disappointing”.
The slowdown in the eurozone is evident and more pronounced than even the most pessimistic expected. Both industrial production, consumer confidence and indicators such as the trade surplus have deteriorated sharply. But there is growth. Despite the bad data, the Italian recession and the fact that the European Commission has had to revise down by more than 30% its own estimates from a month ago, Europe will likely grow in 2019.
China continues to slow down under the weight of its indebted and inefficient model, but it also grows. The United States showed poor retail sales data, but both employment and gross capital formation show that the economy continues to expand. The emerging countries have worsened their prospects, but have navigated the monetary imbalances that deactivated the mirage of synchronized growth in 2018.
What does all this say? We have gone from a shock of euphoria in the first part of 2018 to a shock of pessimism in recent months and back to euphoria, yet macro indicators and corporate profits do not indicate a 2008 recession.
Why? If we remember 2007, the deterioration of the leading macroeconomic indicators was much more aggressive and, in addition, corporate profits showed weakness, poor sales, and margins that could presage what finally happened. It is not the case now. Corporate profits published this month are no party, but show widespread growth and, most importantly, expectations for a mildly decent 2019 and 2020.
Can this change and become a crisis? Yes, and that is why we must keep our attention focused on fundamentals, but the reality is that today we do not see macroeconomic or corporate indicators that indicate a crisis. Rather, the three “Ls” that we mentioned in 2017: low growth, low rates, low inflation.
What has led to this period of market euphoria if the macro data and profits are not spectacular?


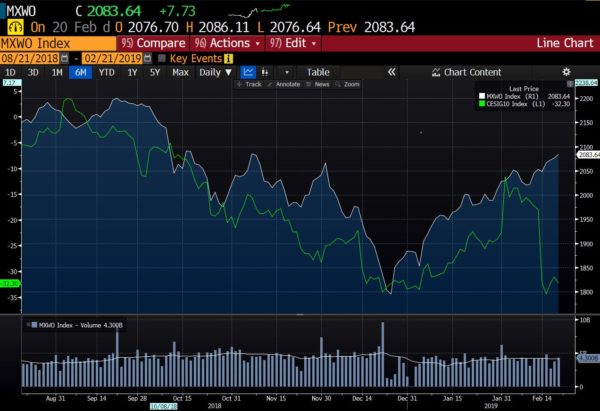
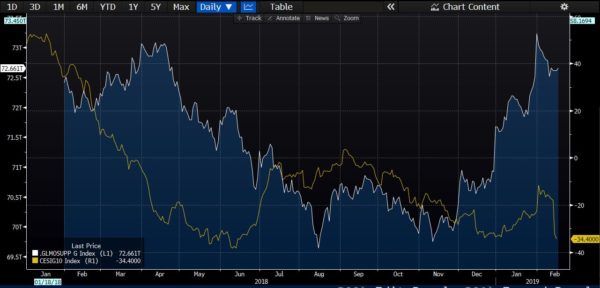
(World Equity Index vs Economic Surprise and Money Supply vs Economic Surprise)
Simply a change of trend in global liquidity led by a U-turn in the process of normalization of central banks. In 2018 we saw the first drop in global liquidity in more than a decade, and that generated significant losses in financial markets. Since the end of December stock markets have rebounded strongly because the data, although poor, is not as bad as feared, and mainly because the Federal Reserve changed its tone on the number of rate hikes, the ECB announced that it would be much more accommodative and the Central Bank of China introduced the largest injection of liquidity in five years.
In fact, between December 26 and February 15 we have seen the largest injection of liquidity in the markets of the last two years, bringing the global money supply to record levels. Bloomberg published my comments in an article (“Follow The Money“) where I said that the global risk rally was driven by soaring money supply, while CNBC published my article reducing the optimistic expectations about the China-US trade agreement (here), which adds to the caution I recommended about the US economy in Forbes (here). Let’s forget the “synchronized growth” and look for opportunities where margins and earnings growth do not depend on abnormal expectations of inflation. Look for de-correlated returns in stocks and bonds of companies that have strengthened cash-flow generation, where margins are stable and growth undemanding. Yes, they may seem more expensive than other asset classes, but the biggest risk in this market is in the optically cheap sectors and assets, and in sovereign bonds. All this gives us strengths to continue analyzing where opportunities are located and in what assets and sectors we see value, in “returning to fundamentals”.
Great article Mr. Lacalle.
Hope all is well with you and your family.
As money velocity(m2) is still low it seems to me that FED has more room to keep dovish and restart QE. Specially after that tightening period. Meanwhile, at the end of 2017 CPI was showing signs of rise reaching 2.7% YTD. FED started to be hawkish bringing some short term strength to USD and some pain to equities. CPI has changed its calculus method 20 times in the last 30 years, as if you use 1980s model we can get a ~10% YOY inflation. As you may know, USA can easily export inflation as well, as having currency monopoly they has plenty of tricks to keep CPI low and also inflating bubbles. However, debt can’t be hidden. What do you think that may happen in a mid-term(2y)? A US inflation rising a little fast or deflation scenario? Thanks.