Brent – WTI differential shrunk recently from $20 to $11.5/bbl.WTI rallied due to the Keystone line fill. Before the pipeline goes into service it needs to be filled up with oil (600kbpd) so there is a continuous flow once it starts up. The pipeline is 485 miles long and goes from Cushing, OK to Nederland, TX. Careful, this is a technical and temporary effect.Meanwhile Brent lost some strength on prospects of rising Libyan crude supply as exports are being restored. An agreement was reached this week between the leaders of tribes disrupting eastern ports’ operations and the government, which could allow exports from the currently closed ports, including Brega, Es-Sider, Marsa al-Hariga & Zueitina, combined capacity 600,000b/d, to resume on Sunday.
Mexico passed its energy reform bill yesterday opening up its oil industry to outside investment for the first time in 75 years. Companies will be offered production sharing contracts, which could result in a resurgence in Mexican oil production, but it will take several years and tens of billions to happen. Mexico’s crude production has declined to c2.5mmbpd from 3.5mmbpd in the past years due to poor investment. I bet Mexico doesn’t return to 3.5mmbpd quickly in the next years.
Coal rose to $84.5/mt on renewed concerns of high increase in vessel freight rates for coal in 2014, driving traders to add to stocks. Australian exports still offset winter demand growth. However, according to the WSJ, global coal consumption could grow as little as 2% a year through 2017 in the face of weakening Chinese demand, mentioning the International Energy Agency’s most recent coal-market report. Long-term estimates for Chinese coal demand, for the year 2035, range from 3.66 billion tons of coal equivalent, up from 2.29 billion tons in 2010, to as low as 1.51 billion tons, depending on Beijing’s environmental policies.
IEA medium term coal market report:
. China is to account for 60% of new global demand, without reaching its peak within the next 5 years.
. India will rival China as the top importer in the next 5 years.
. Despite the slightly slower pace of growth, however, coal will meet more of the increase in global primary energy than oil or gas.
CO2 at €4.9/mt stays weak after the market discounted the EU backloading vote, which addresses little of the oversupply of EUAs. The EU Parliament voted through the approval for the backloading of 900m tn of CO2 permits. Backloading anyway doesn’t address the structural oversupply that exists in the ETS of more than 2b tn. Following that another vote is due by the EU Ministers next week (December 16th) and then the Environment Committee will have to go over the details with another vote at the EU Parliament for final approval due next year. The EU is aiming for March/April finalisation.
US gas has strengthened to $4.25/mmbtu after three consecutive weeks of tightening inventories, reducing the gas glut. Storage this week fell 81bcf, bullish versus the 5-year average of a 64bcf withdrawal. Since September, weather has been 2% colder than the 5-year average. Over the last month, the weather adjusted Supply/Demand balance has been just 2.6bcf/d less than the 5-year average.
Producer discipline is being evident, although not as one would expect. This week lower 48 States production fell just 0.8% (0.58 bcf/d). Louisiana had the largest volumetric decrease at 5.3% (0.34bcf/d) due to maintenance & normal well decline. Wyoming dropped 5.9% (0.33bcf/d) primarily because of a gas plant being shut down for most of the month. Gulf of Mexico production rose 6% (0.2 bcf/d) having completed platform and pipeline maintenance performed last month. Production, however, keeps rising year-on-year.
UK gas remains rangebound at 70.15p/therm (-0.07%), and I expect it to remain rangebound as inventories stay unchanged and weather is milder. Storage remains at 4,394mcm and volumes from Norway into Langeled pick up 3.8% this week.
Power prices drop throughout the EU as industrial production disappoints again. Eurozone Industrial Production in October was -1.1% vs expectations of +0.3% (Prev. -0.5%, Rev. -0.2%).
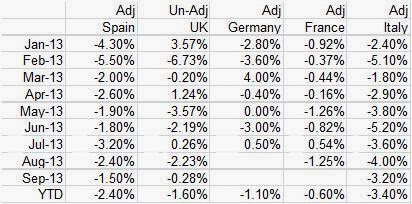
Here are the scary figures of power demand in Europe:
We had Italian power demand data this week and it came much worse than expected (-2% in November, -3.5% yoy), driven by poor industrial demand. Thermal production was down 2.4% in November and 13% year to date due to increased geothermal, wind and solar production and to offset the lower demand. Solar production increased by 16.9% (ytd +18.5%), wind was up 15.7% (ytd +19.5%) and geothermal +10.2% (ytd +1.5%).
